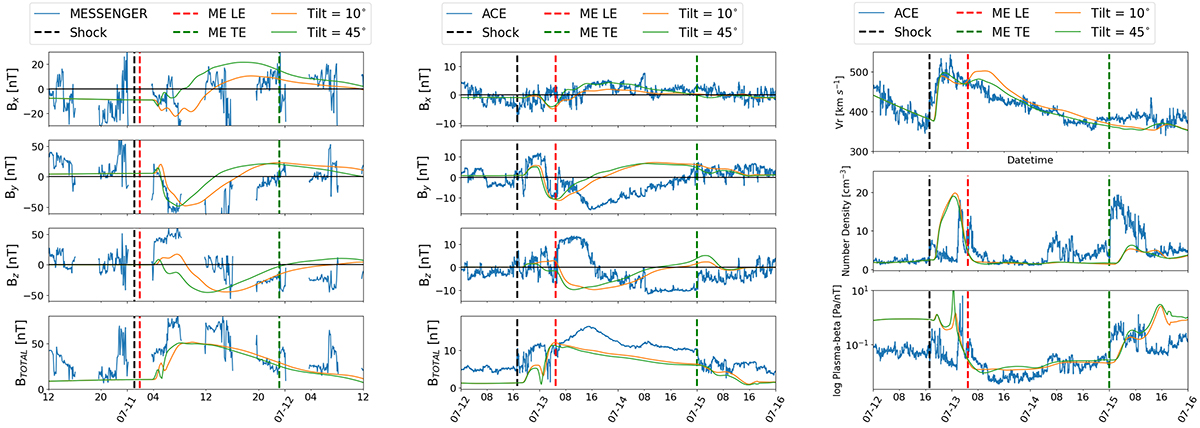
Fig. 8.
Download original image
Observations at Mercury and ACE plotted in blue similar to Figures 5 and 6. The left panel represents magnetic field components at MESSENGER and the middle and right panels show those at ACE. The orange curve corresponds to the same parameter setup as reported previously, with the tilt = 10° and green corresponds to the same parameter set, apart from tilt = 45°. The simulations are performed on an AMR level 4 grid.
Current usage metrics show cumulative count of Article Views (full-text article views including HTML views, PDF and ePub downloads, according to the available data) and Abstracts Views on Vision4Press platform.
Data correspond to usage on the plateform after 2015. The current usage metrics is available 48-96 hours after online publication and is updated daily on week days.
Initial download of the metrics may take a while.