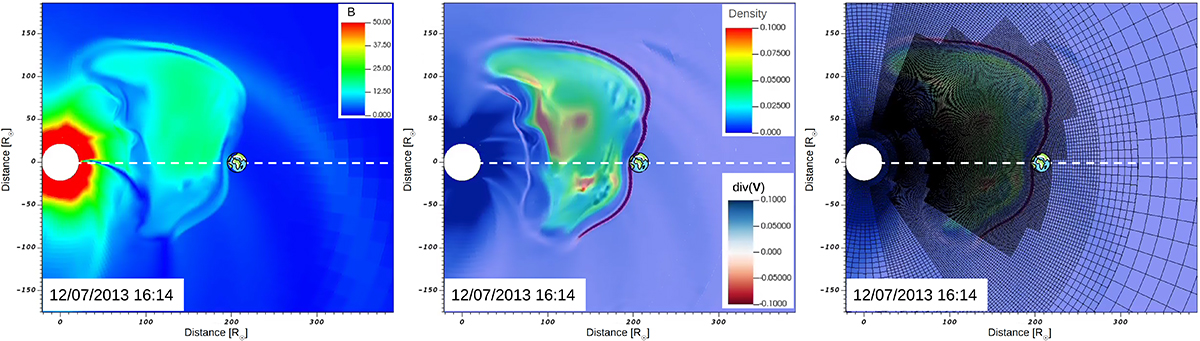
Fig. 7.
Download original image
Equatorial plane in Icarus at the arrival time of the disturbance at 1 au. The distance from the Sun is indicated on the horizontal and vertical axes. The left panel shows the slice coloured with total magnetic field values. The middle panel shows the plasma density inside the CME overlaid with the divergence of velocity values. The right panel shows the medium panel with the computational grid plotted on top. The frame is rotated so that Earth is fixed at 0 longitude. The white dashed line is along the Sun–Earth line.
Current usage metrics show cumulative count of Article Views (full-text article views including HTML views, PDF and ePub downloads, according to the available data) and Abstracts Views on Vision4Press platform.
Data correspond to usage on the plateform after 2015. The current usage metrics is available 48-96 hours after online publication and is updated daily on week days.
Initial download of the metrics may take a while.