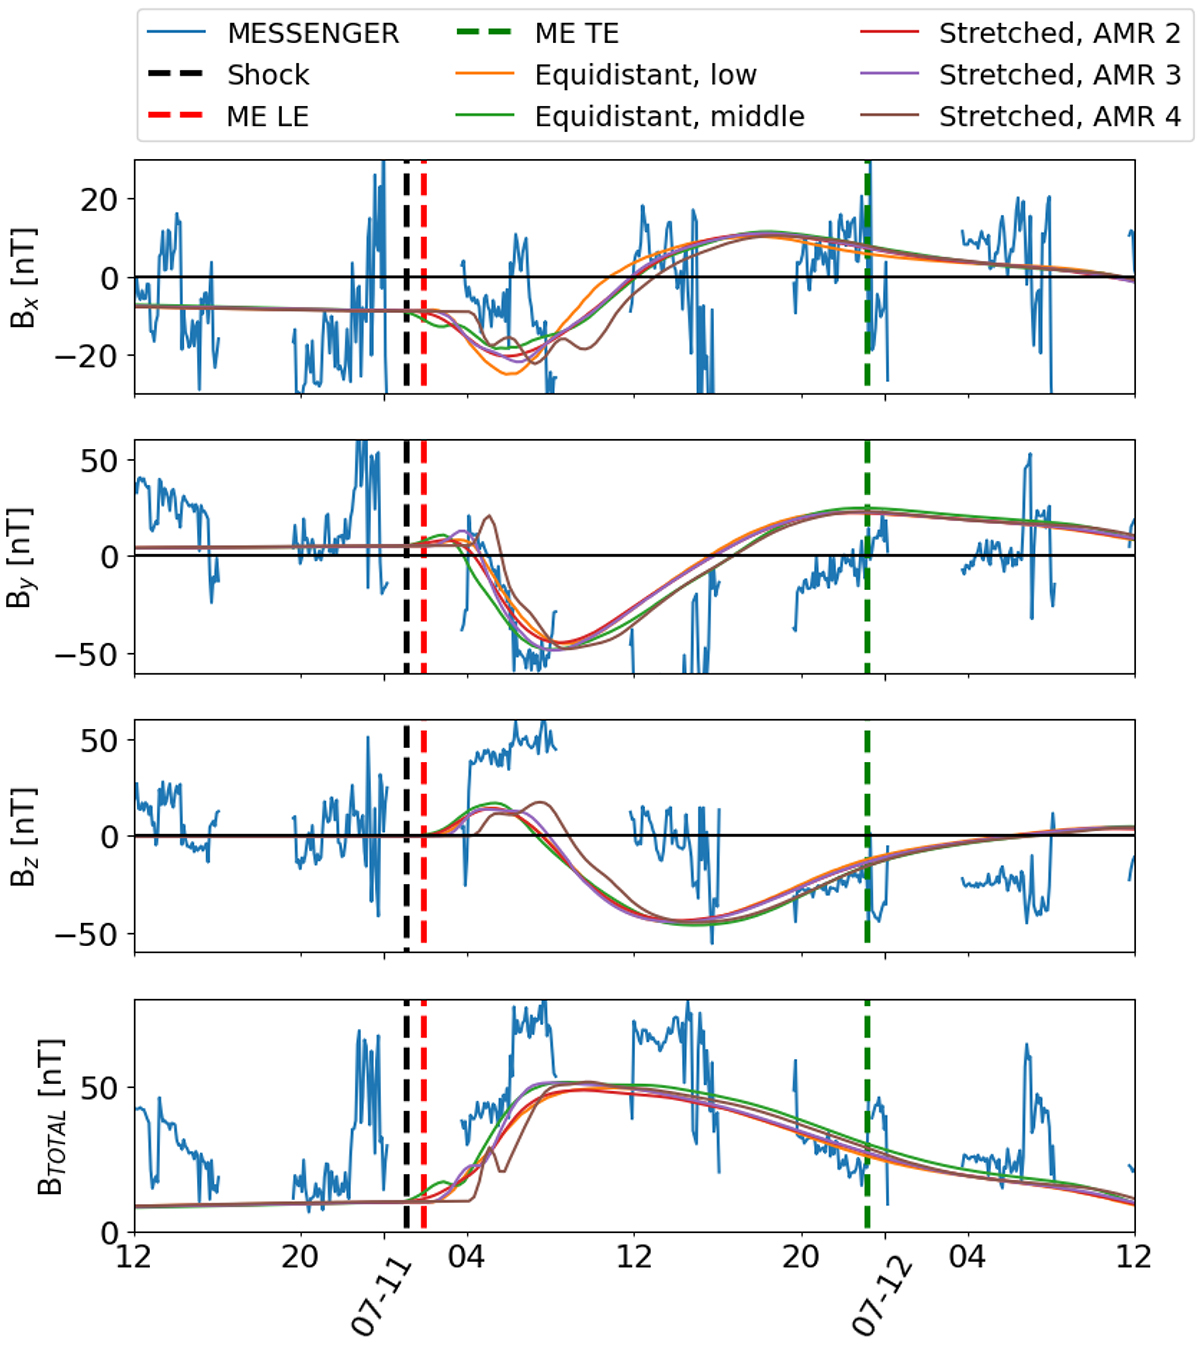
Fig. 5.
Download original image
Simulations performed with different numerical grids in Icarus. The blue line corresponds to in situ data observed at the MESSENGER spacecraft. Magnetic field components are plotted. The black, red, and green lines indicate shock arrival time, the ME LE, and the ME TE, respectively. Equidistant grid simulations on the low and medium-resolution grids are given in orange and green. The simulations performed on the stretched grid with AMR levels 2, 3, and 4 are given in red, purple, and brown, respectively.
Current usage metrics show cumulative count of Article Views (full-text article views including HTML views, PDF and ePub downloads, according to the available data) and Abstracts Views on Vision4Press platform.
Data correspond to usage on the plateform after 2015. The current usage metrics is available 48-96 hours after online publication and is updated daily on week days.
Initial download of the metrics may take a while.