Fig. 17.
Download original image
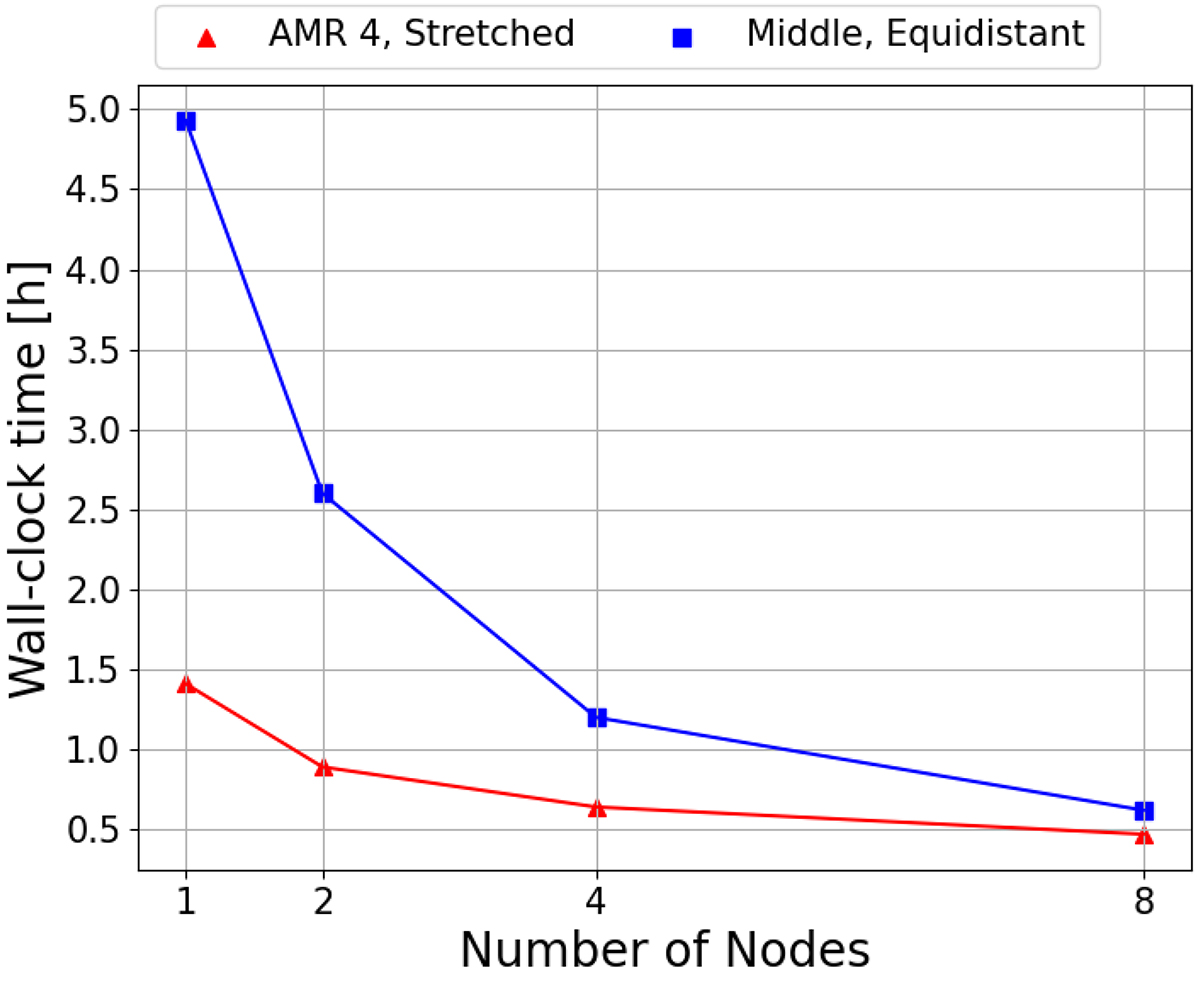
The timing tests for the medium-resolution simulation on the equidistant grid and the AMR level 4 simulation on the stretched grid. The horizontal axis denotes the number of nodes, and the vertical axis denotes the wall clock time in hours. The simulations are performed on the given amount of nodes with 2 Xeon Gold 6240 CPUs@2.6 GHz (Cascadelake), 18 cores each, on the Genius cluster at KU Leuven.
Current usage metrics show cumulative count of Article Views (full-text article views including HTML views, PDF and ePub downloads, according to the available data) and Abstracts Views on Vision4Press platform.
Data correspond to usage on the plateform after 2015. The current usage metrics is available 48-96 hours after online publication and is updated daily on week days.
Initial download of the metrics may take a while.