Fig. 14.
Download original image
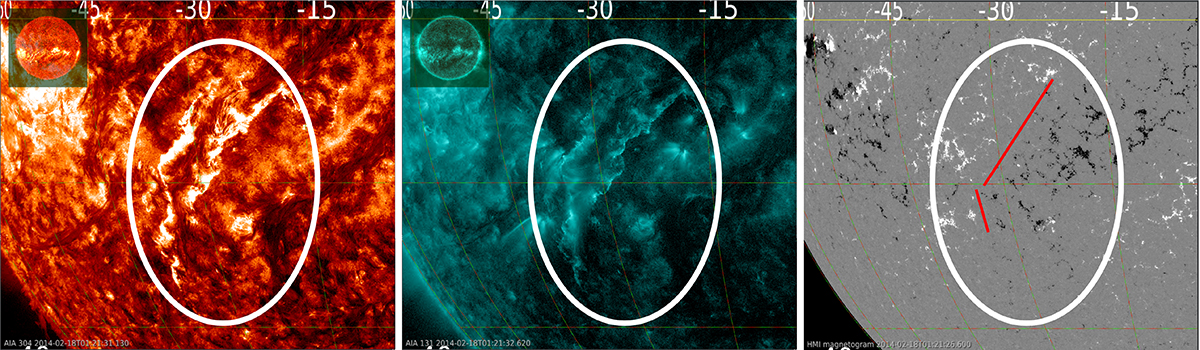
The images taken from JHelioviewer correspond to the source of CMEA event before the eruption at 01:21:26 on February 18, 2014. The left and right panels show the images of the solar atmosphere in Solar Dynamics Observatory/Atmospheric Imaging Assembly 304 Å and 131 Å wavelengths, respectively. The white circle highlights the filament area. The right panel shows the HMI magnetogram with the red lines corresponding to the polarity inversion lines (PIL) found in the filament region.
Current usage metrics show cumulative count of Article Views (full-text article views including HTML views, PDF and ePub downloads, according to the available data) and Abstracts Views on Vision4Press platform.
Data correspond to usage on the plateform after 2015. The current usage metrics is available 48-96 hours after online publication and is updated daily on week days.
Initial download of the metrics may take a while.