Open Access
Fig. 13.
Download original image
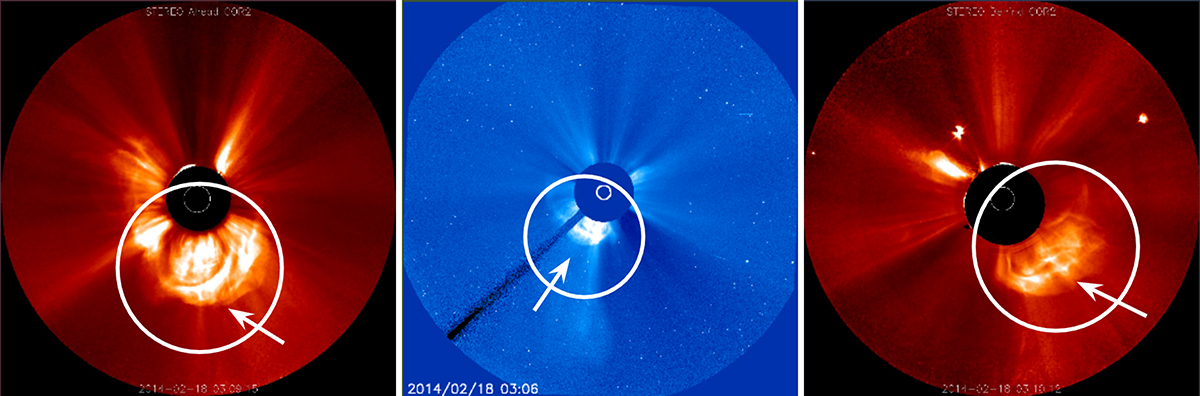
The white-light images seen from STEREO-A Cor2, SOHO/LASCO Cor3 and STEREO-B C2 ∼1.5 hours after the CMEA eruption. The figure is generated with the Stereo CME Analysis Tool.
Current usage metrics show cumulative count of Article Views (full-text article views including HTML views, PDF and ePub downloads, according to the available data) and Abstracts Views on Vision4Press platform.
Data correspond to usage on the plateform after 2015. The current usage metrics is available 48-96 hours after online publication and is updated daily on week days.
Initial download of the metrics may take a while.