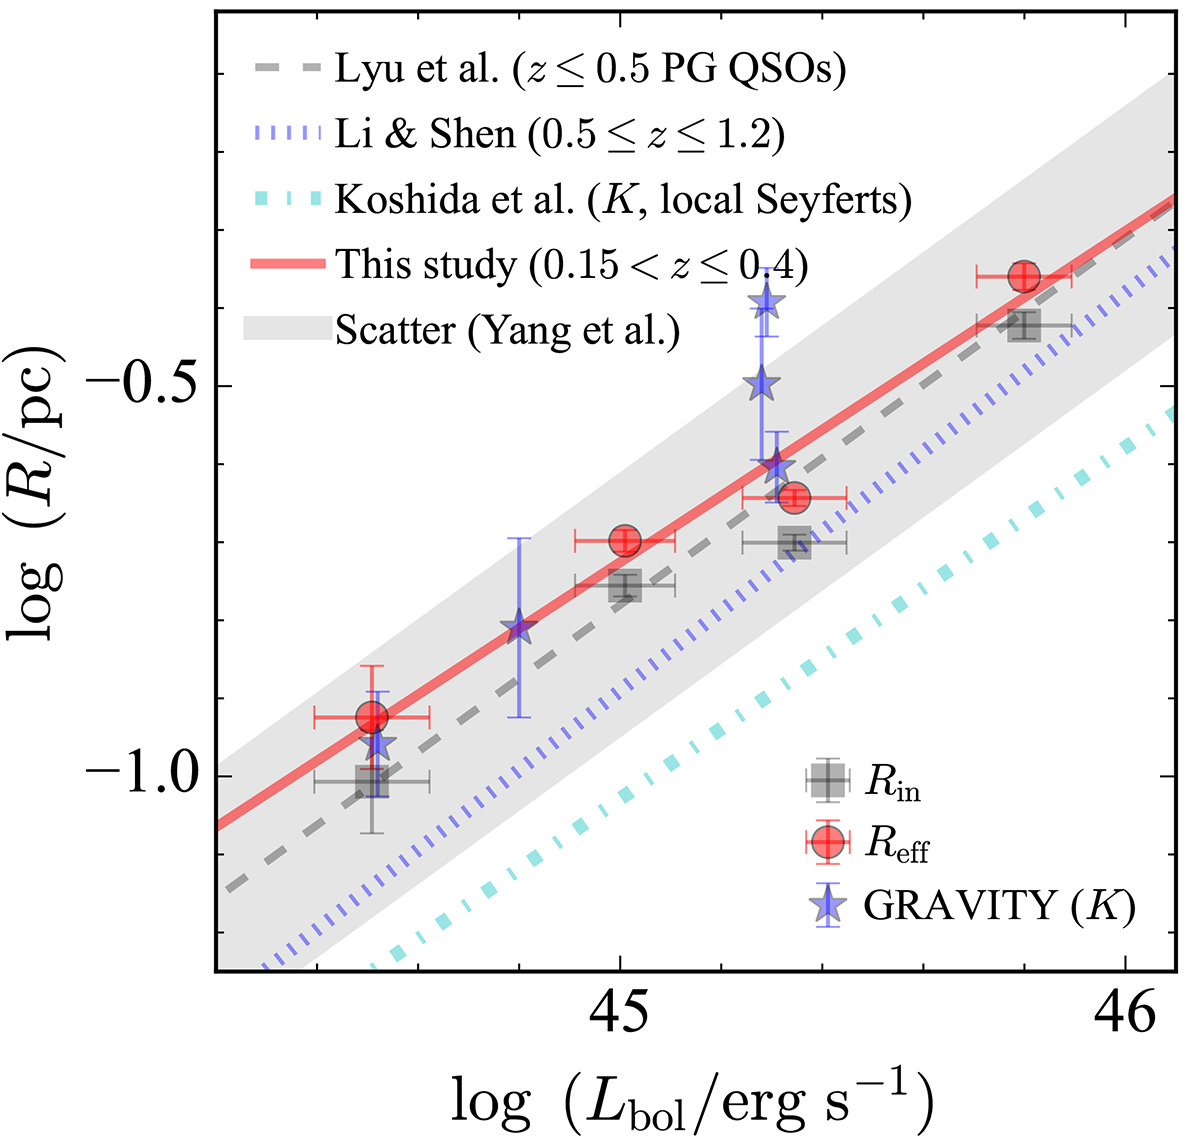
Fig. 5.
Download original image
Size-luminosity relation of the torus of type 1 AGNs. Gray squares denote the inner radius of the torus derived from fitting the MIR SFs with the toy model of the torus. Red circles represent the effective size of the torus estimated from the best-fit transfer function, with the solid red line giving their ordinary distance regression fit to the size-luminosity relation. The uncertainties of Rin are the same as those of Reff. The dashed gray line shows the size-luminosity relation of low-redshift (z < 0.5) PG quasars estimated using the RM method (Lyu et al. 2019). The shaded gray area represents the 1σ scatter (∼0.17 dex) estimated from a sample of relatively high-redshift (0.3 < z < 2) AGNs (Yang et al. 2020). The dotted blue line is the relation of intermediate-redshift (0.5 ≤ z ≤ 1.2) quasars in Stripe 82, based on a direct comparison between the optical SFs and MIR (W1) SFs, similar to this study. The dash-dotted cyan line denotes the relation of the local Seyferts in the K band inferred from the RM method. Blue stars represent the size of the torus estimated from the K-band interferometry measurements (GRAVITY Collaboration 2020).
Current usage metrics show cumulative count of Article Views (full-text article views including HTML views, PDF and ePub downloads, according to the available data) and Abstracts Views on Vision4Press platform.
Data correspond to usage on the plateform after 2015. The current usage metrics is available 48-96 hours after online publication and is updated daily on week days.
Initial download of the metrics may take a while.