Open Access
Fig. 2.
Download original image
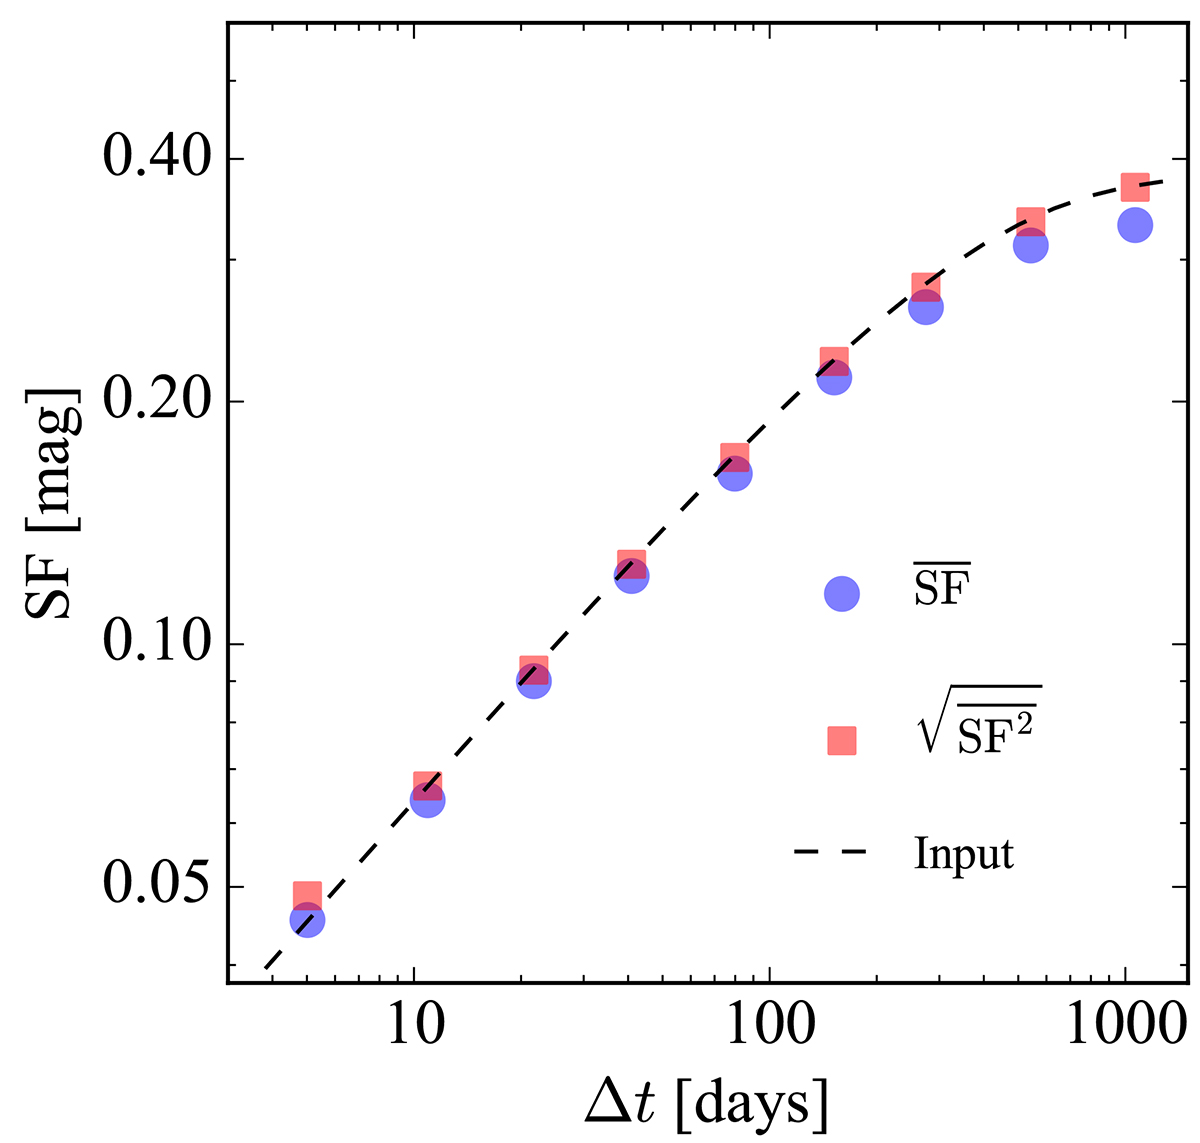
Ensemble SFs derived from the mock light curves. The 10 000 light curves were generated to mimic the real multi-epoch data from ZTF. The dashed line denotes the input SF. The red squares and blue circles represent the square root of the mean SF2 and the mean of SF, respectively.
Current usage metrics show cumulative count of Article Views (full-text article views including HTML views, PDF and ePub downloads, according to the available data) and Abstracts Views on Vision4Press platform.
Data correspond to usage on the plateform after 2015. The current usage metrics is available 48-96 hours after online publication and is updated daily on week days.
Initial download of the metrics may take a while.