Fig. 1.
Download original image
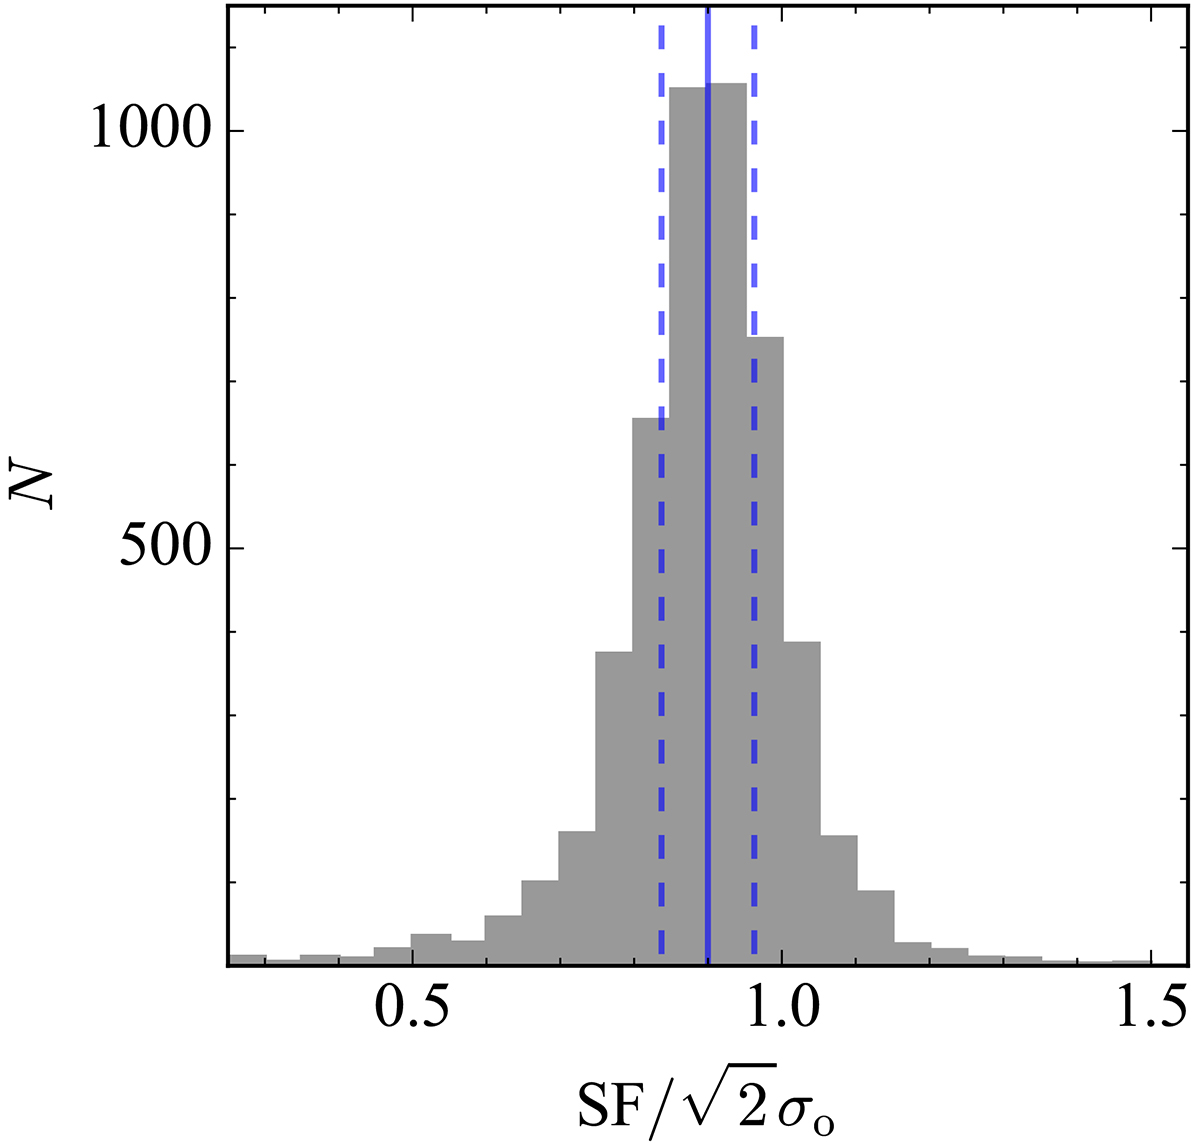
Distribution of SFs divided by ![]() and the original photometric uncertainty (σo) of the g-band light curves of the non-variable sources. The solid blue line denote the median value (0.90) and the dashed lines give its median absolute deviation (0.06). If the photometric noise is estimated robustly, the median value should be equal to 1; the median value of 0.90 indicates that the photometric uncertainty is underestimated.
and the original photometric uncertainty (σo) of the g-band light curves of the non-variable sources. The solid blue line denote the median value (0.90) and the dashed lines give its median absolute deviation (0.06). If the photometric noise is estimated robustly, the median value should be equal to 1; the median value of 0.90 indicates that the photometric uncertainty is underestimated.
Current usage metrics show cumulative count of Article Views (full-text article views including HTML views, PDF and ePub downloads, according to the available data) and Abstracts Views on Vision4Press platform.
Data correspond to usage on the plateform after 2015. The current usage metrics is available 48-96 hours after online publication and is updated daily on week days.
Initial download of the metrics may take a while.