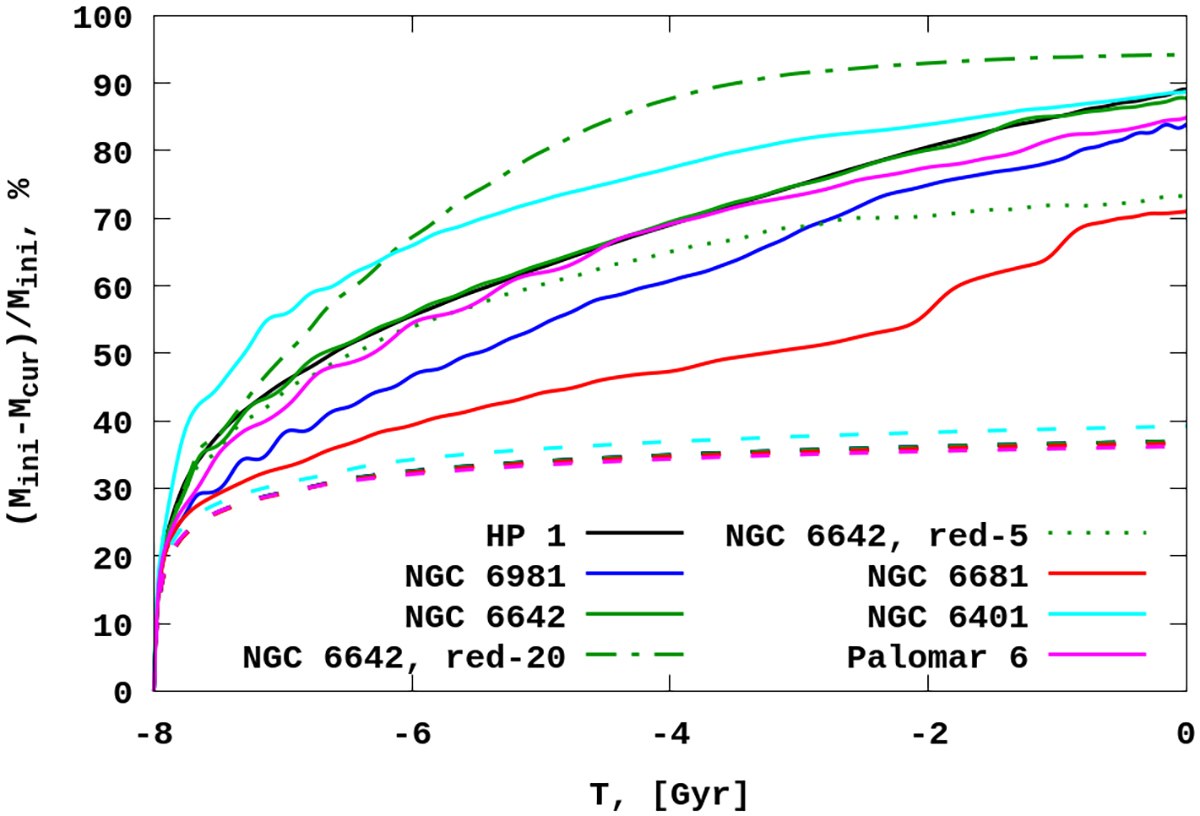
Fig. 3.
Download original image
Evolution of the mass loss in the GCs in percent due to mass loss and orbital type. The solid lines represent the full mass loss of the clusters with a reduction factor of 10. The dotted and dot-dashed green lines represent the NGC 6642 models with reduction factors of 5 and 20. The dashed lines represent the mass loss that is only due to the stellar evolution.
Current usage metrics show cumulative count of Article Views (full-text article views including HTML views, PDF and ePub downloads, according to the available data) and Abstracts Views on Vision4Press platform.
Data correspond to usage on the plateform after 2015. The current usage metrics is available 48-96 hours after online publication and is updated daily on week days.
Initial download of the metrics may take a while.