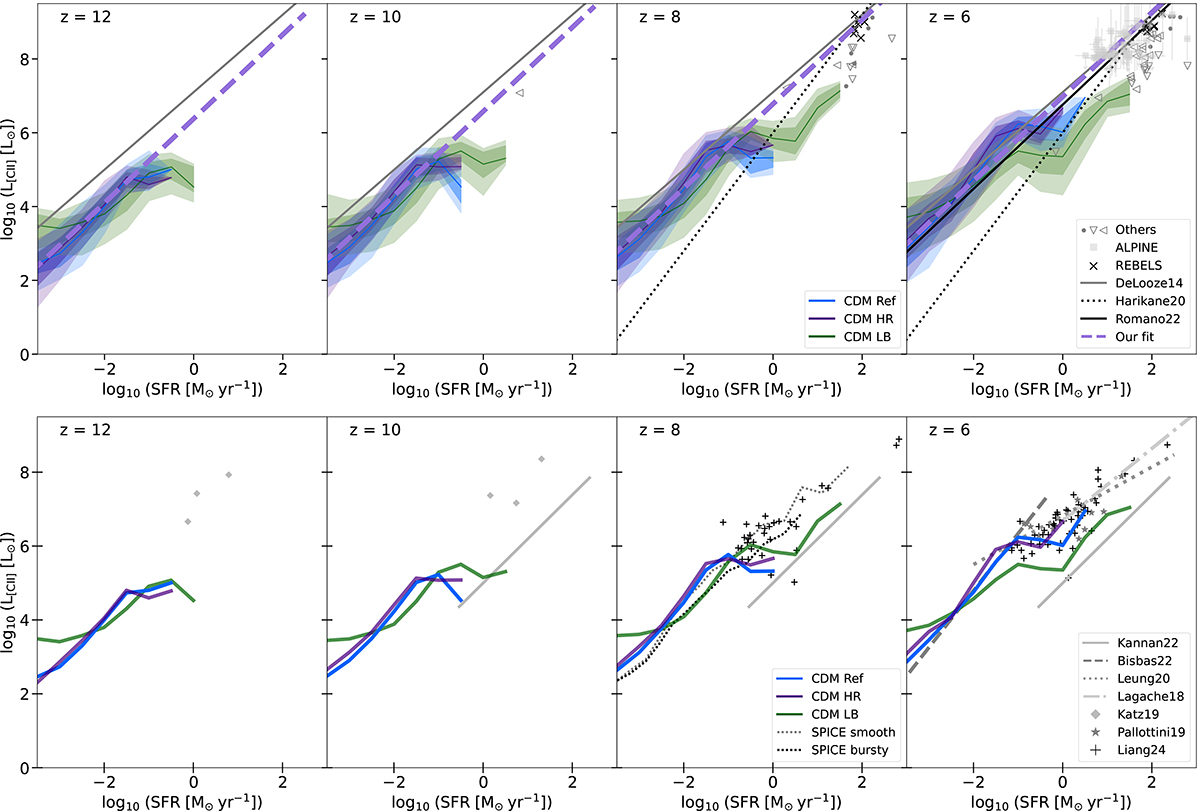
Fig. 7.
Download original image
[C II] luminosity as a function of star formation rate. The top and bottom panels show comparisons with observations and other numerical works, respectively. The panels from left to right display predictions at z = 12, 10, 8, and 6. The solid lines represent the mean values and the darker (lighter) shaded regions represent the 1σ (2σ) standard deviation for CDM Ref (blue), CDM HR (purple), and CDM LB (green). The top row also displays the linear fit to the CDM HR results (purple dashed line), the De Looze et al. (2014) fit made with star forming galaxies in the Local Universe (solid grey), the fit of the ALPINE data – which accounts for [C II] non-detections – from Romano et al. (2022, solid black), and the fit by Harikane et al. (2020) to z = 6 − 9 ALMA observed galaxies (dotted black). The symbols refer to the ALMA large observational programs ALPINE (squares; Béthermin et al. 2020; Le Fèvre et al. 2020) and REBELS (crosses; Bouwens et al. 2022; Ferrara et al. 2022), which target [C II] emission at z = 4.5 − 6 and z = 6.5 − 7.7, respectively. The other data are from a compilation from Liang et al. (2024), where downward-pointing triangles refer to upper limits in L[C II] and left-pointing triangles to upper limits in SFR. In the bottom row, the other grey lines refer to fits of results of previous investigations, while the grey symbols to simulations of individual galaxies. Specifically, we show semi-analytical calculations by Lagache et al. (2018, dashed-dotted line), post-processed zoom-in haloes by Pallottini et al. (2019, stars), Katz et al. (2019, diamonds) and Bisbas et al. (2022, dashed line), and post-processed cosmological boxes by Leung et al. (2020, dotted line), Kannan et al. (2022, solid line), Liang et al. (2024, crosses), and Bhagwat et al. (in prep.; black dotted and grey dotted lines for the bursty and smooth stellar feedback, respectively). The comparison indicates that the slope and the amplitude of the relation vary from one model to the other, although we note that our results are in good agreement with most observational and theoretical studies reported in this plot.
Current usage metrics show cumulative count of Article Views (full-text article views including HTML views, PDF and ePub downloads, according to the available data) and Abstracts Views on Vision4Press platform.
Data correspond to usage on the plateform after 2015. The current usage metrics is available 48-96 hours after online publication and is updated daily on week days.
Initial download of the metrics may take a while.