Fig. 6.
Download original image
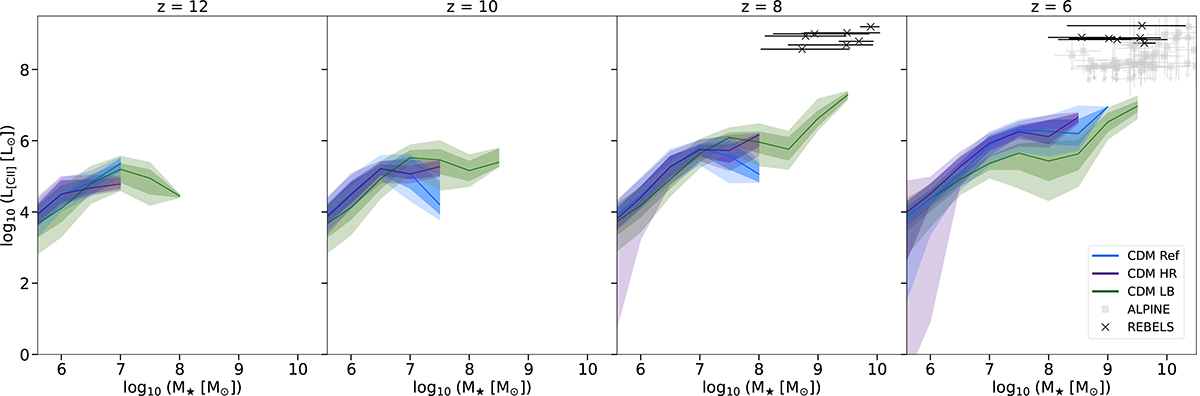
[C II] luminosity as a function of halo stellar mass. The panels from left to right display predictions at z = 12, 10, 8, and 6. The solid lines represent the mean values and the darker (lighter) shaded regions represent the 1σ (2σ) standard deviation for CDM Ref (blue), CDM HR (purple), and CDM LB (green). The symbols refer to the ALMA large observational programs ALPINE (squares; Béthermin et al. 2020; Le Fèvre et al. 2020) and REBELS (crosses; Bouwens et al. 2022; Ferrara et al. 2022), which target [C II] emission at z = 4.5 − 6 and z = 6.5 − 7.7, respectively.
Current usage metrics show cumulative count of Article Views (full-text article views including HTML views, PDF and ePub downloads, according to the available data) and Abstracts Views on Vision4Press platform.
Data correspond to usage on the plateform after 2015. The current usage metrics is available 48-96 hours after online publication and is updated daily on week days.
Initial download of the metrics may take a while.