Fig. 3.
Download original image
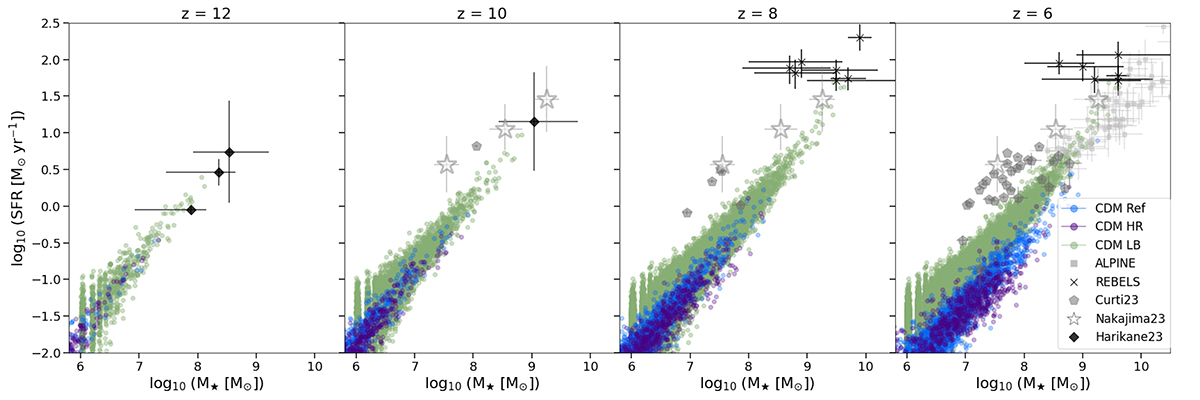
Star formation rate as a function of stellar mass at z = 12, 10, 8, and 6. The coloured dots refer to predictions from CDM HR (purple), CDM Ref (blue), and CDM LB (green). Grey symbols are data from ALPINE (squares; Béthermin et al. 2020; Le Fèvre et al. 2020), REBELS (crosses; Bouwens et al. 2022; Ferrara et al. 2022), and JWST results described in Nakajima et al. (2023, stars), Curti et al. (2023, pentagons), and Harikane et al. (2023, diamonds). Globally, our results agree well with observations.
Current usage metrics show cumulative count of Article Views (full-text article views including HTML views, PDF and ePub downloads, according to the available data) and Abstracts Views on Vision4Press platform.
Data correspond to usage on the plateform after 2015. The current usage metrics is available 48-96 hours after online publication and is updated daily on week days.
Initial download of the metrics may take a while.