Fig. D.1
Download original image
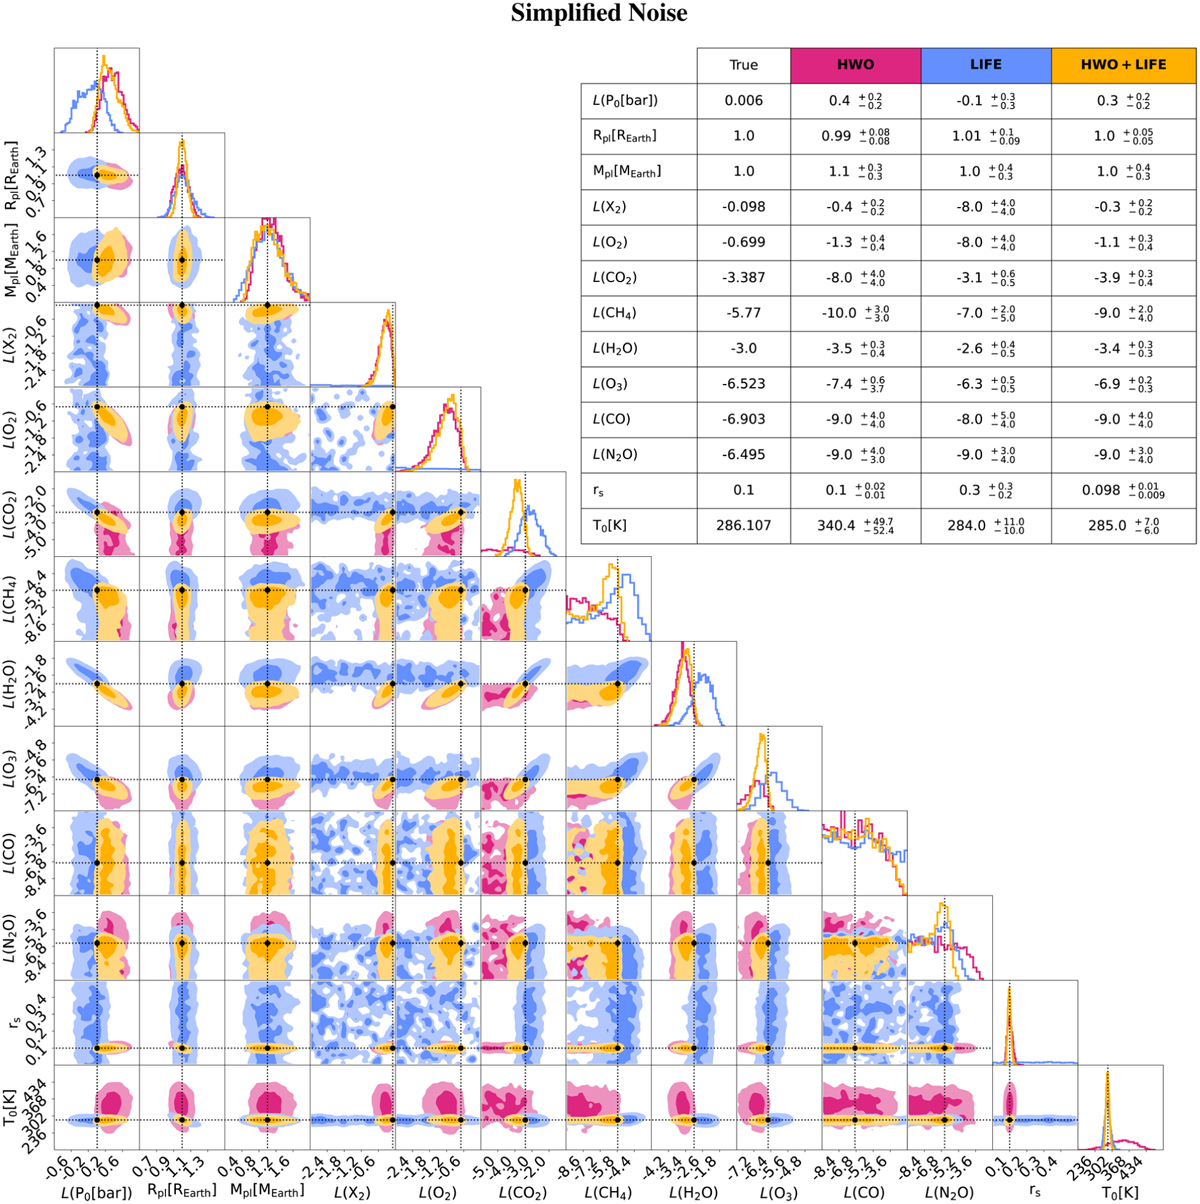
Corner plot for the posterior distributions from the “simplified noise” retrieval set. The black lines indicate the expected values for every parameter. The median and 1σ uncertainties for relevant retrieved and derived parameters are shown in the table in the top right corner. The scenarios are color-coded according to Table 3.
Current usage metrics show cumulative count of Article Views (full-text article views including HTML views, PDF and ePub downloads, according to the available data) and Abstracts Views on Vision4Press platform.
Data correspond to usage on the plateform after 2015. The current usage metrics is available 48-96 hours after online publication and is updated daily on week days.
Initial download of the metrics may take a while.