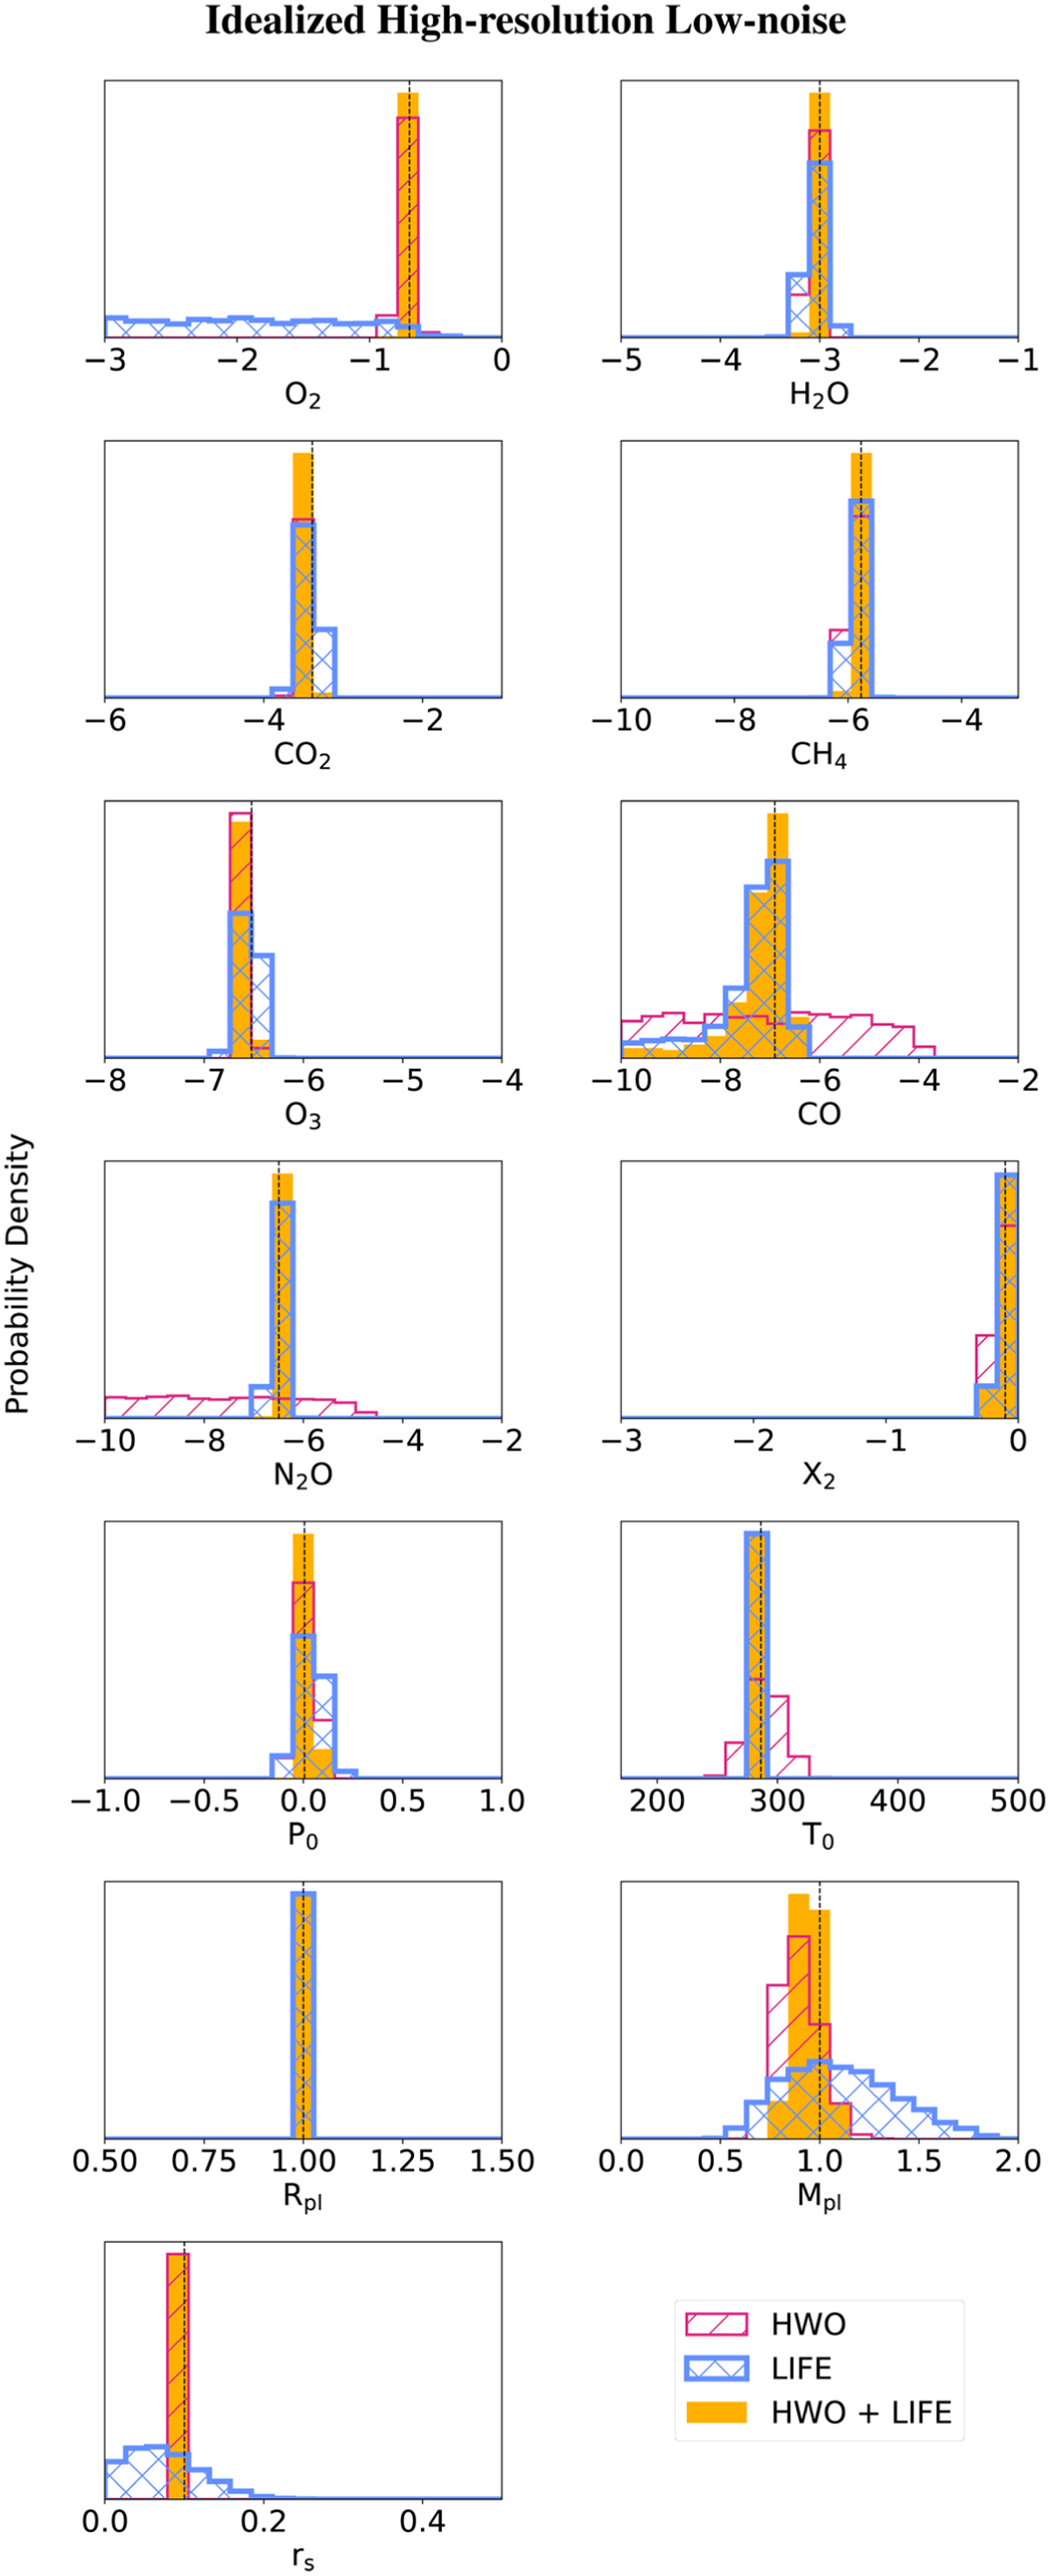
Fig. B.3
Download original image
Posterior density distributions from the “idealized highresolution low-noise” retrieval set (photon noise only at S/N = 50, R = 1000). The black lines indicate the expected values for every parameter. HWO posteriors are shown in magenta with diagonal hatching. LIFE posteriors are shown in cyan with crossed hatching. HWO+LIFE posteriors are shown as fully colored yellow histograms.
Current usage metrics show cumulative count of Article Views (full-text article views including HTML views, PDF and ePub downloads, according to the available data) and Abstracts Views on Vision4Press platform.
Data correspond to usage on the plateform after 2015. The current usage metrics is available 48-96 hours after online publication and is updated daily on week days.
Initial download of the metrics may take a while.