Fig. B.2
Download original image
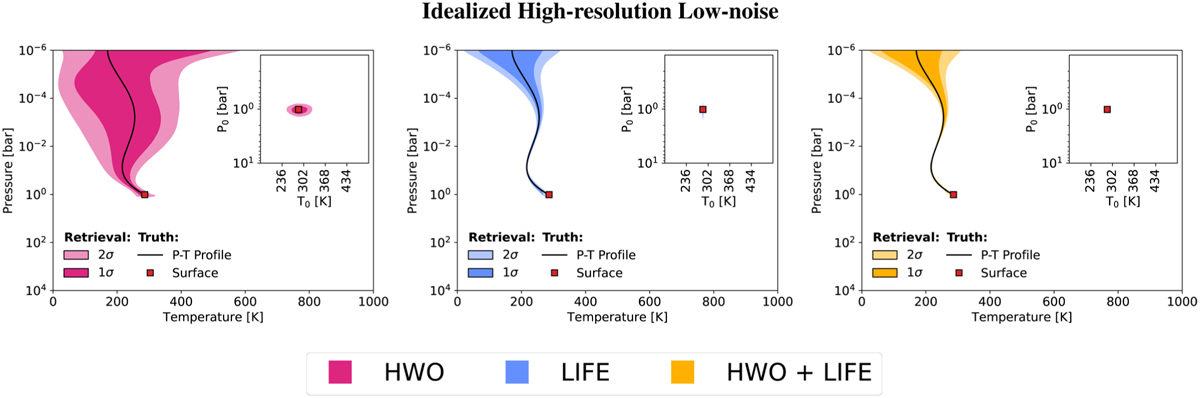
Retrieved pressure-temperature profiles for the “idealized high-resolution low-noise” retrieval set (photon noise only at S/N = 50, R = 1000). Left panel: Pure HWO retrieval (magenta). Central panel: Pure LIFE retrieval (blue). Right panel: HWO+LIFE retrieval (yellow). In all panels, the 2σ and the 1σ intervals are shown in increasingly darker hues, as well as the input profiles (black lines) for comparison. Inside each panel, the inset plot shows the 2D posterior space of the ground pressure and temperature. In all panels and the inset plots, the surface pressure and temperature point in the P-T space is shown as a red square marker.
Current usage metrics show cumulative count of Article Views (full-text article views including HTML views, PDF and ePub downloads, according to the available data) and Abstracts Views on Vision4Press platform.
Data correspond to usage on the plateform after 2015. The current usage metrics is available 48-96 hours after online publication and is updated daily on week days.
Initial download of the metrics may take a while.