Fig. A.1
Download original image
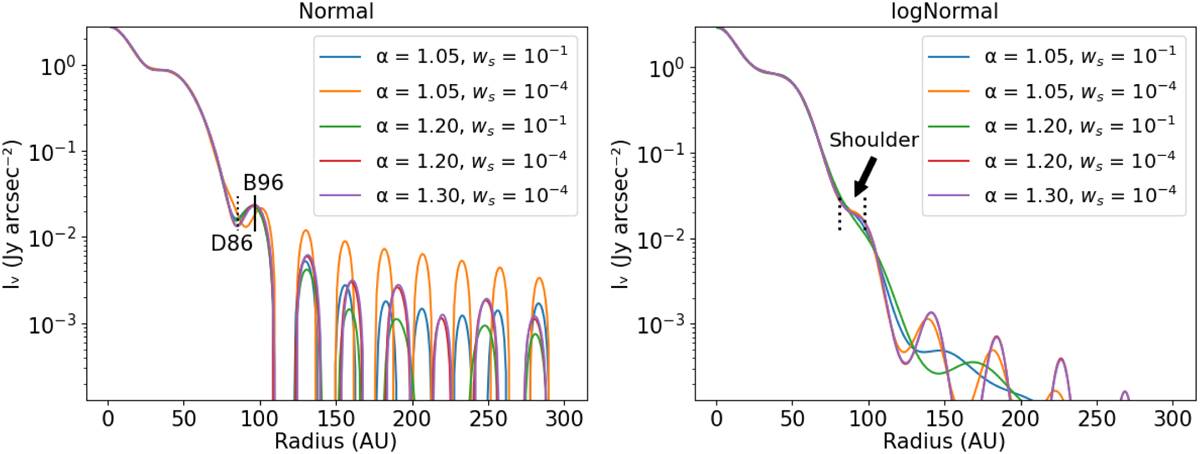
(Left) Brightness profiles reconstructed with frank’s “Normal” method using different α and wsmooth values. We get a dip and a peak resembling substructures, which are labelled as D86 and B96 respectively. These are shown with dotted and solid lines. (Right) Brightness profiles reconstructed with frank’s “logNormal” method using the same α and wsmooth values as the plot on the left. We get a shoulder-like emission between 80 au and 97 au. The extent of the shoulder is shown with dotted lines. The intensity axis is cut off at the rms of the 0.65 mm observation (0.14 mJy arcsec−2).
Current usage metrics show cumulative count of Article Views (full-text article views including HTML views, PDF and ePub downloads, according to the available data) and Abstracts Views on Vision4Press platform.
Data correspond to usage on the plateform after 2015. The current usage metrics is available 48-96 hours after online publication and is updated daily on week days.
Initial download of the metrics may take a while.