Fig. 4
Download original image
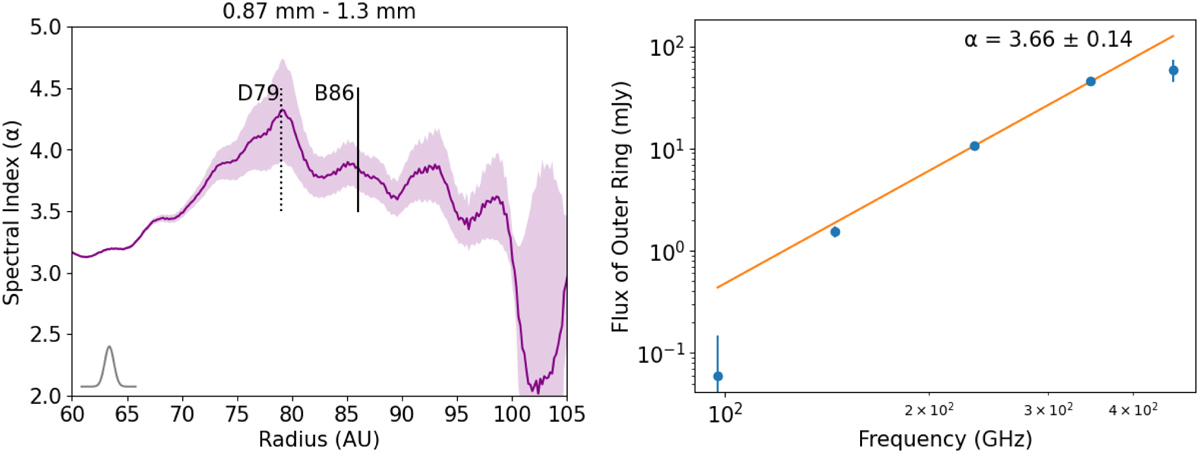
(Left) 0.87–1.3 mm spectral index profile of TW Hya’s outer disk (R ≥ 60 au). This is plotted with the intensity profiles in Fig. 3. The shaded purple region represents the uncertainty calculated through the propagation of error in the intensity. The dotted and solid lines show the locations for D79 and B86 respectively. The bottom left corner shows the profile of the synthesized beam (0.05″ × 0.05″; PA = 0.0°) from their parent images. (Right) Spectral index of TW Hya’s outer ring with Eq. (2). The outer ring flux is calculated using the method described in Sect. 3.4.1 and the resultant values are shown in the second last column of Table 3.
Current usage metrics show cumulative count of Article Views (full-text article views including HTML views, PDF and ePub downloads, according to the available data) and Abstracts Views on Vision4Press platform.
Data correspond to usage on the plateform after 2015. The current usage metrics is available 48-96 hours after online publication and is updated daily on week days.
Initial download of the metrics may take a while.