Fig. 2
Download original image
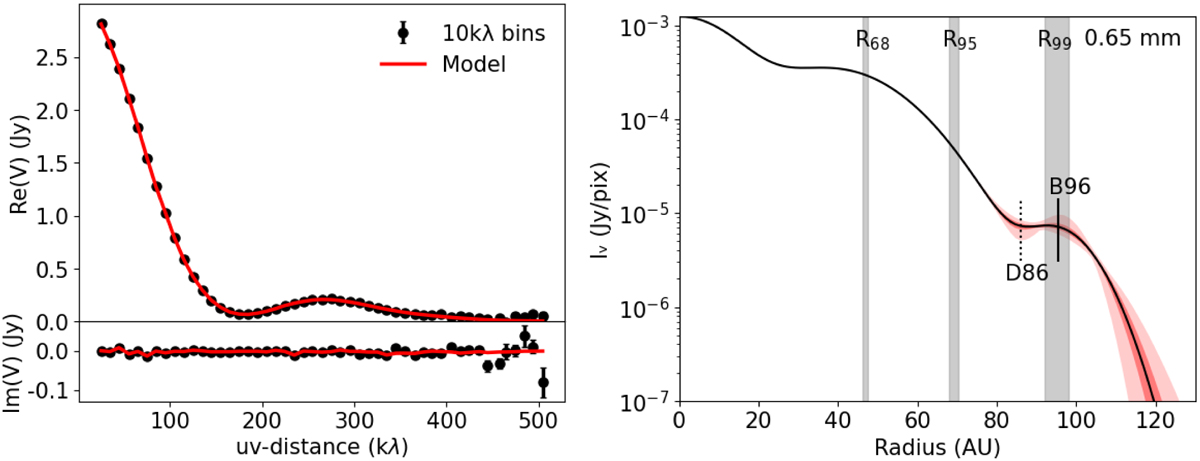
Results of parametric modeling: (left) the re-centered and deprojected visibilities of the 0.65 mm observation binned to 10 kλ, where the top row shows the real part and the bottom row shows the imaginary part. The visibilities of the best fit model is shown in red. (Right) Intensity profile of the TW Hya protoplanetary disk at 0.65 mm made with 5000 random posteriors of our MCMC sample. The median intensity profile is shown with a black curve, whereas the 1σ and 3σ uncertainties are shown with dark and light red shaded regions respectively. The local minima and maxima representing a dark gap and a bright ring at 86 and 96 au are shown with dotted and solid lines respectively. The disk size estimates are shown as R68, R95 and R99 in the form of gray columns.
Current usage metrics show cumulative count of Article Views (full-text article views including HTML views, PDF and ePub downloads, according to the available data) and Abstracts Views on Vision4Press platform.
Data correspond to usage on the plateform after 2015. The current usage metrics is available 48-96 hours after online publication and is updated daily on week days.
Initial download of the metrics may take a while.