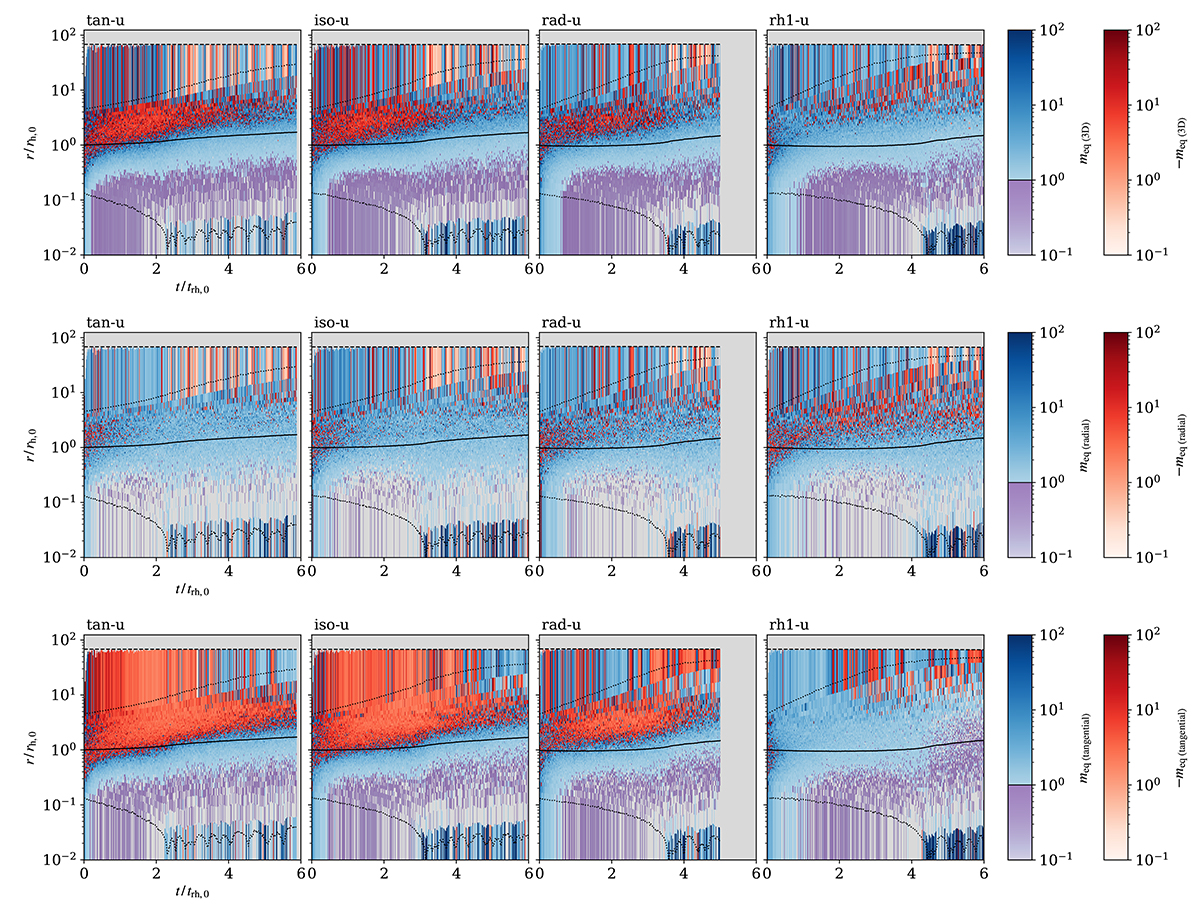
Fig. 9.
Download original image
Time evolution of the equipartition mass, meq, in the underfilling SCs (top row – calculated from the 3D velocity dispersion; middle row – calculated only from its radial component; bottom row – calculated only from its tangential component). The regions that evolve towards EEP (to lower positive values of meq) are in shades of blue and purple, and the regions that evolve away from EEP (to negative meq, i.e. away from EEP) are in shades of red; see the colour bars. To give a sense of the radial scale and dynamical evolution of the SCs in each plot, we also show the 1% L.r., half-mass radius, 99% L.r., and the tidal radius (from bottom to top; black lines). If the fit is poorly defined due to an insufficient number of data points in a radius–mass bin, we mask the corresponding pixel with grey. We note that because of the log-scale on the vertical axis, the bins below 2% may appear more prominent than the other bins despite covering a smaller radial range.
Current usage metrics show cumulative count of Article Views (full-text article views including HTML views, PDF and ePub downloads, according to the available data) and Abstracts Views on Vision4Press platform.
Data correspond to usage on the plateform after 2015. The current usage metrics is available 48-96 hours after online publication and is updated daily on week days.
Initial download of the metrics may take a while.