Fig. 8.
Download original image
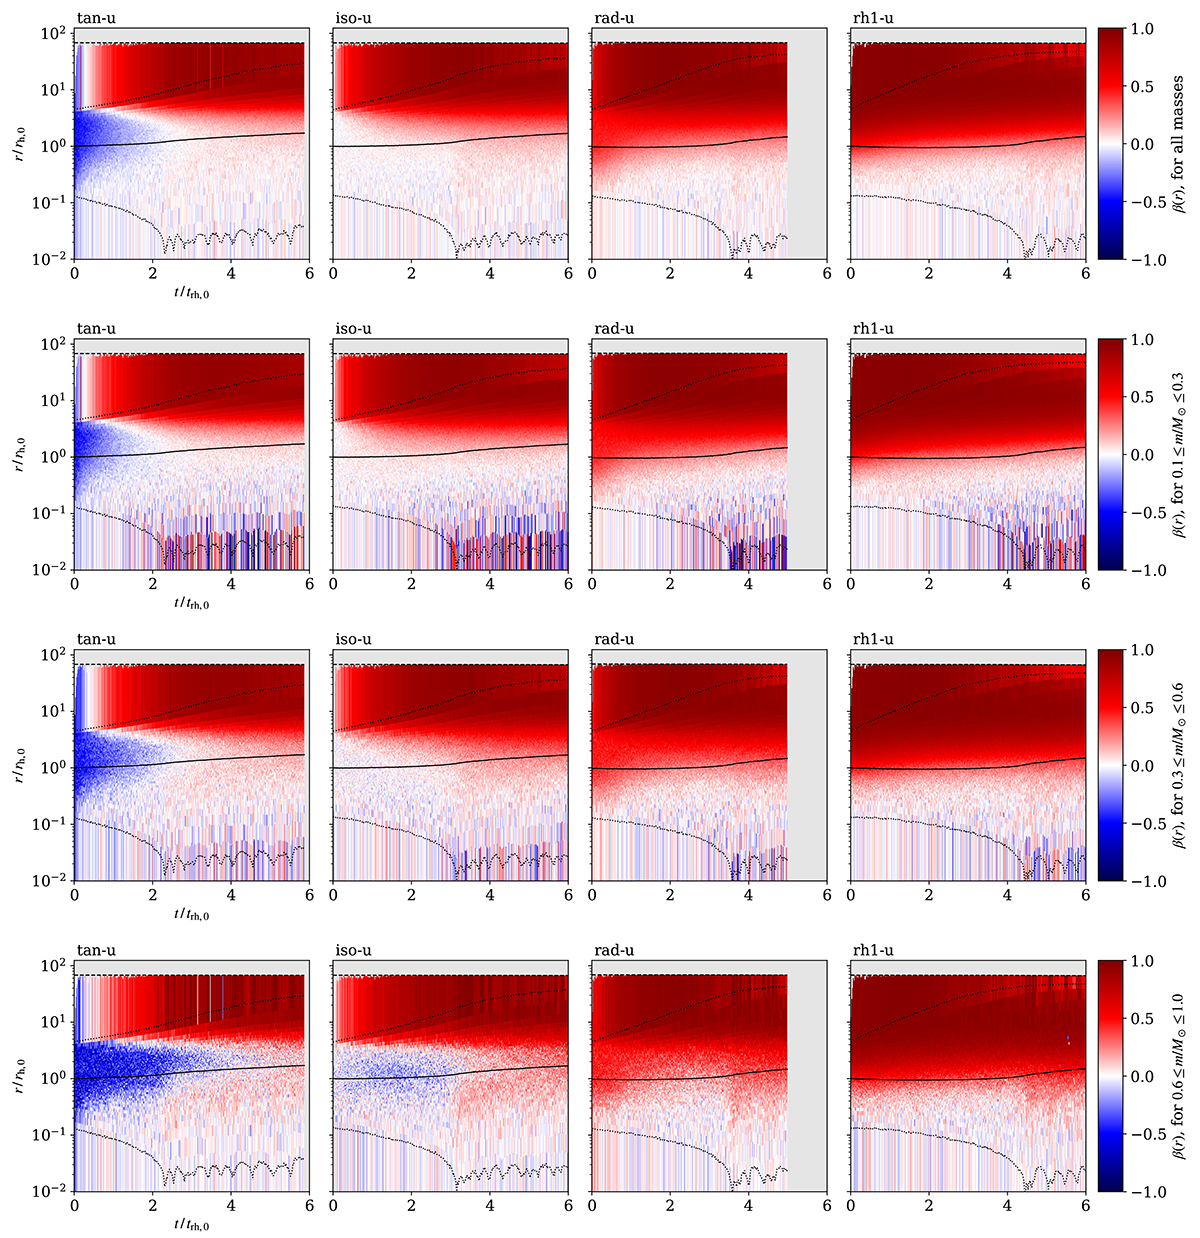
Time evolution of β(r), defined by Eq. (1), in the underfilling models. The top row shows β calculated from the velocity dispersion of all stars in the SC (regardless of mass), and the rows below are calculated for specific mass groups – from the least massive in the second row, intermediate-mass in row three, and the most massive stars in the bottom row (see also the labels on the right-hand side). Red colours correspond to radial anisotropy, and blue colours to tangential anisotropy. If the fit is poorly defined because of an insufficient number of data points in a radius–mass bin, we mask the corresponding pixel in grey. To give a sense of the radial scale and dynamical evolution of the SCs in each plot, we also show the 1% L.r., the half-mass radius, the 99% L.r., and the tidal radius (from bottom to top; black lines). We note that because of the log-scale on the vertical axis, the bins below 2% may appear more prominent than the other bins despite covering a smaller radial range.
Current usage metrics show cumulative count of Article Views (full-text article views including HTML views, PDF and ePub downloads, according to the available data) and Abstracts Views on Vision4Press platform.
Data correspond to usage on the plateform after 2015. The current usage metrics is available 48-96 hours after online publication and is updated daily on week days.
Initial download of the metrics may take a while.