Fig. 10.
Download original image
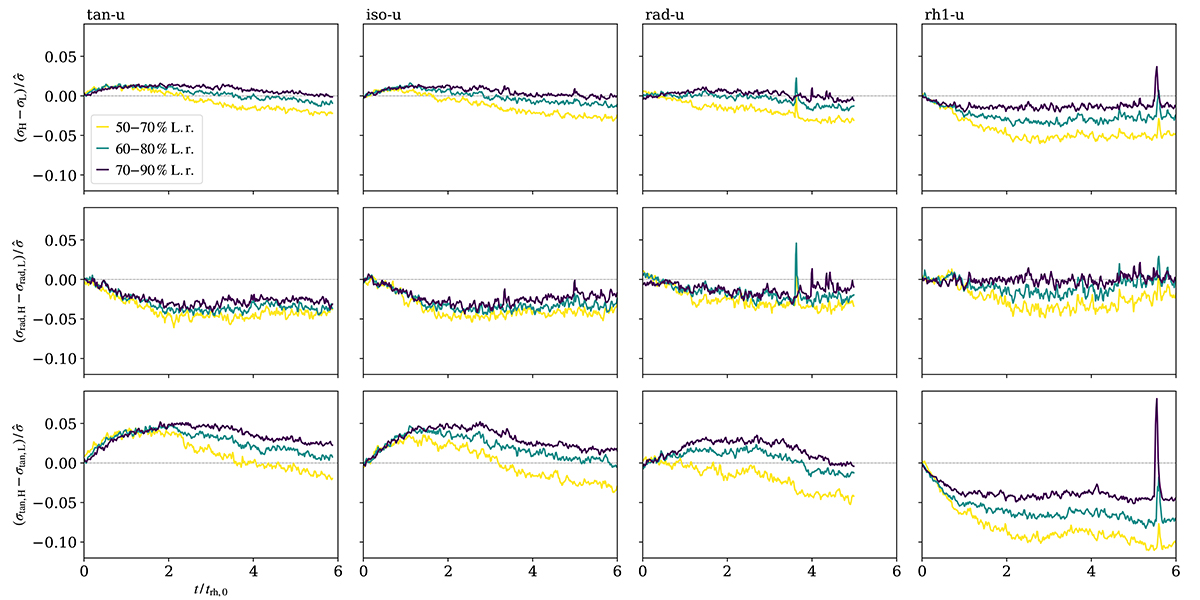
Time evolution of the difference between the velocity dispersion of the high-mass stars (‘H’, 0.8 ≤ m/M⊙ ≤ 1.0) and that of the low-mass stars (‘L’, 0.1 ≤ m/M⊙ ≤ 0.2). The velocity dispersion is scaled by ![]() . The rows show the difference in the total σ (top), its radial component (middle), and its tangential component (bottom). The columns are separated by models (as labelled on top). Each plot has three lines which represent three outside regions of the clusters, delimited by the listed Lagrangian radii.
. The rows show the difference in the total σ (top), its radial component (middle), and its tangential component (bottom). The columns are separated by models (as labelled on top). Each plot has three lines which represent three outside regions of the clusters, delimited by the listed Lagrangian radii.
Current usage metrics show cumulative count of Article Views (full-text article views including HTML views, PDF and ePub downloads, according to the available data) and Abstracts Views on Vision4Press platform.
Data correspond to usage on the plateform after 2015. The current usage metrics is available 48-96 hours after online publication and is updated daily on week days.
Initial download of the metrics may take a while.