Fig. 4.
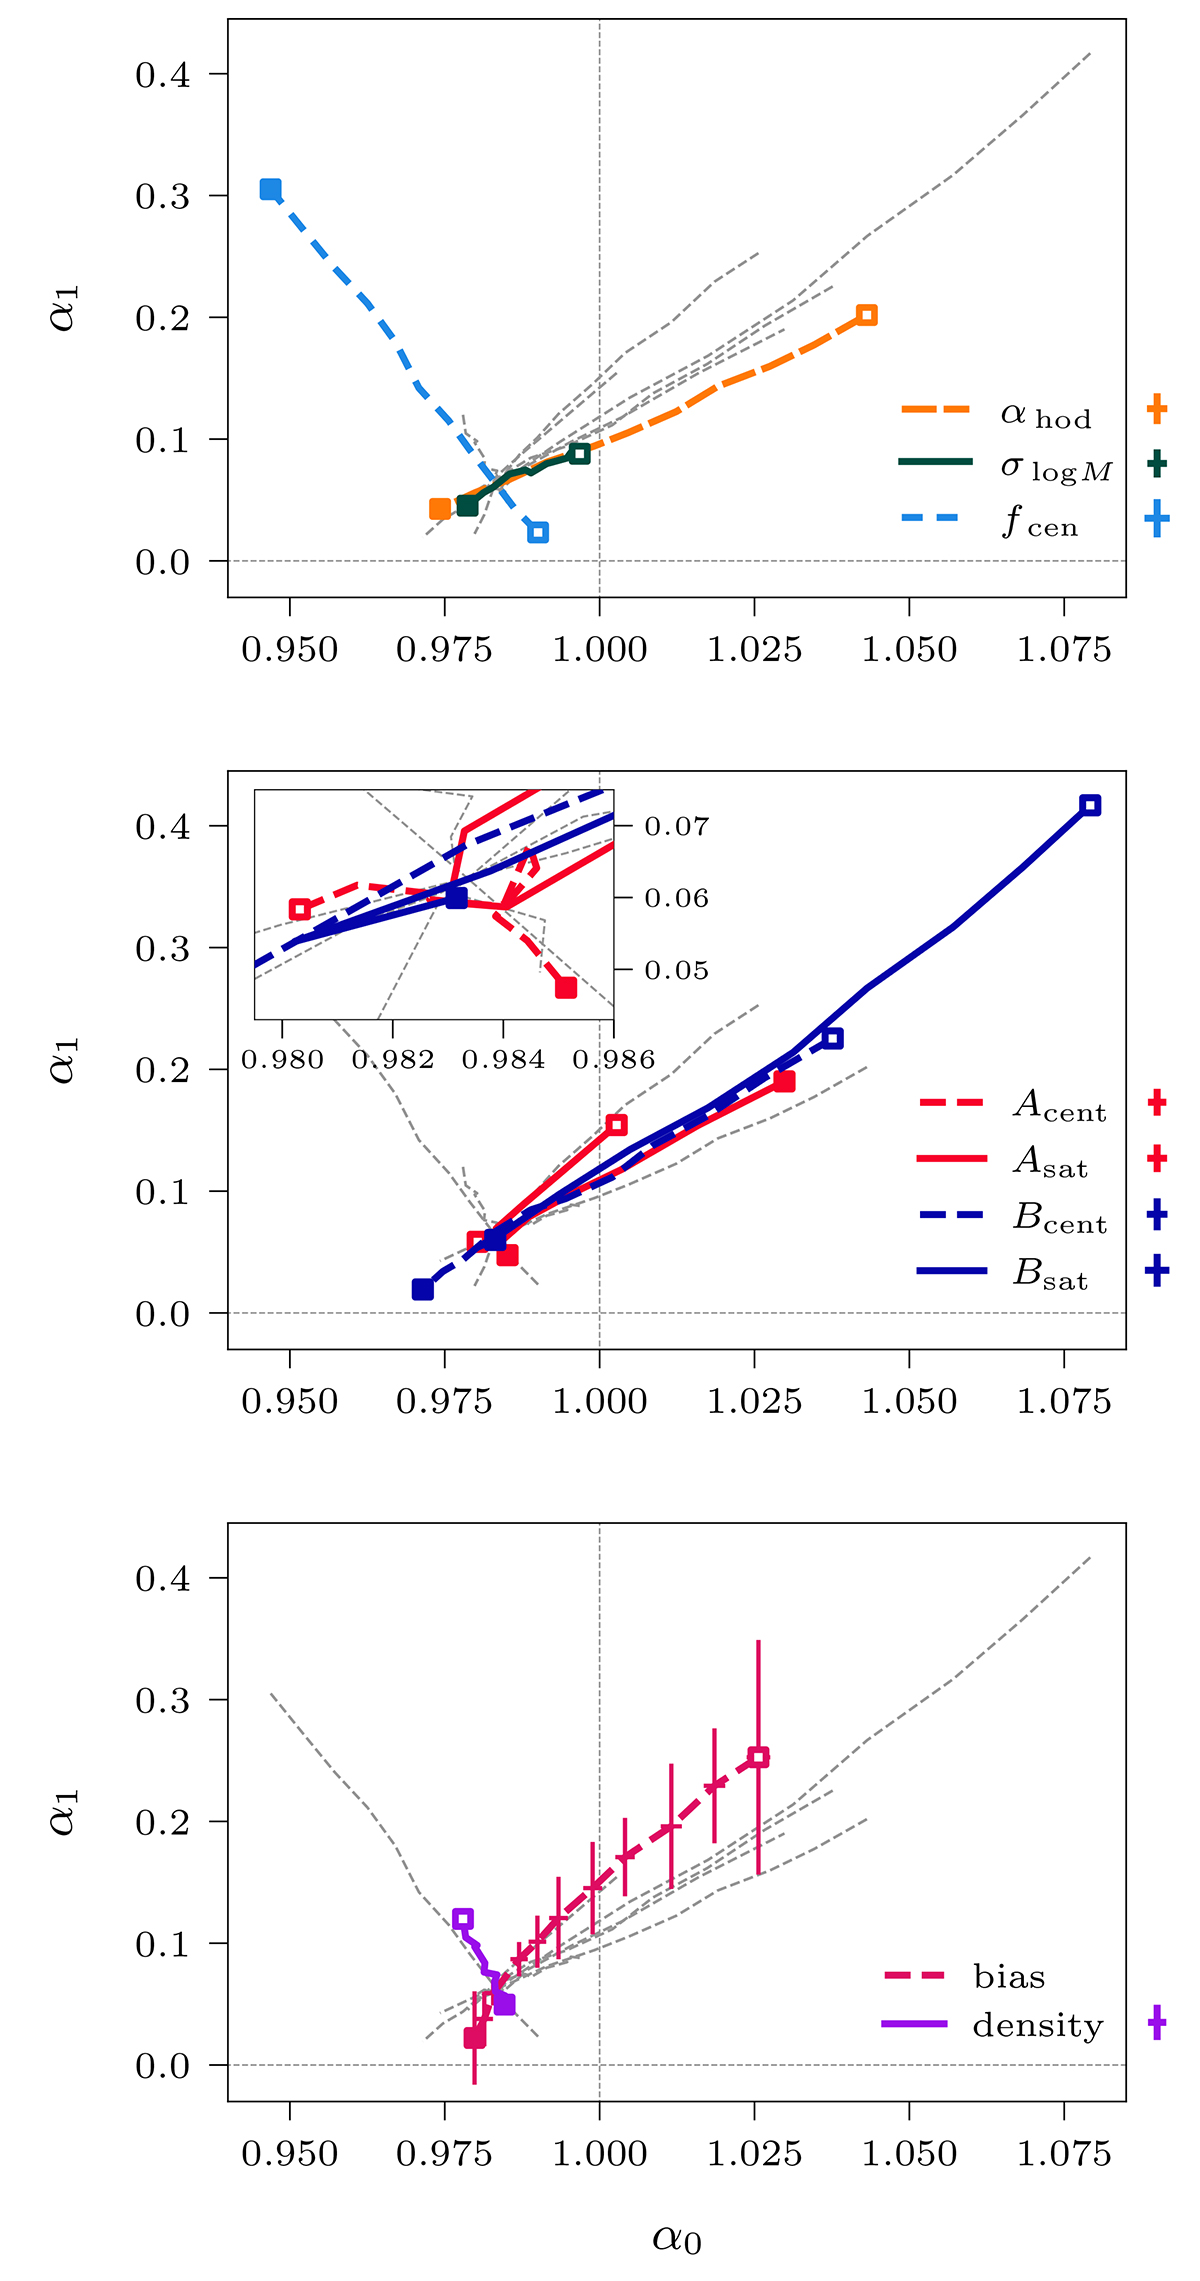
Download original image
Stochasticity parameters α0 and α1 corresponding to the HOD curves of Fig. 3. Top panel: Stochasticity for the curves that vary the HOD parameters αhod, σlog M, and fcen. Middle panel: Stochasticity for the curves that vary the assembly bias parameters Acent, Asat, Bcent, and Bsat (inset: closeup of the curve for Acent). Bottom panel: Stochasticity for the curves that vary the target values of bias and density. Open and filled squares correspond to the HODs with the lowest and highest parameter values, respectively, for the parameter being varied in each curve. Error bars to the right of each panel indicate maximum spatial jackknife error in α0 and α1 across all 11 points in a curve. Errors are plotted point-by-point for galaxy bias (bottom panel) due to the larger range of error sizes for α1. Dashed lines at α0 = 1 and α1 = 0 indicate the stochasticity parameter values corresponding to Poisson shot noise.
Current usage metrics show cumulative count of Article Views (full-text article views including HTML views, PDF and ePub downloads, according to the available data) and Abstracts Views on Vision4Press platform.
Data correspond to usage on the plateform after 2015. The current usage metrics is available 48-96 hours after online publication and is updated daily on week days.
Initial download of the metrics may take a while.