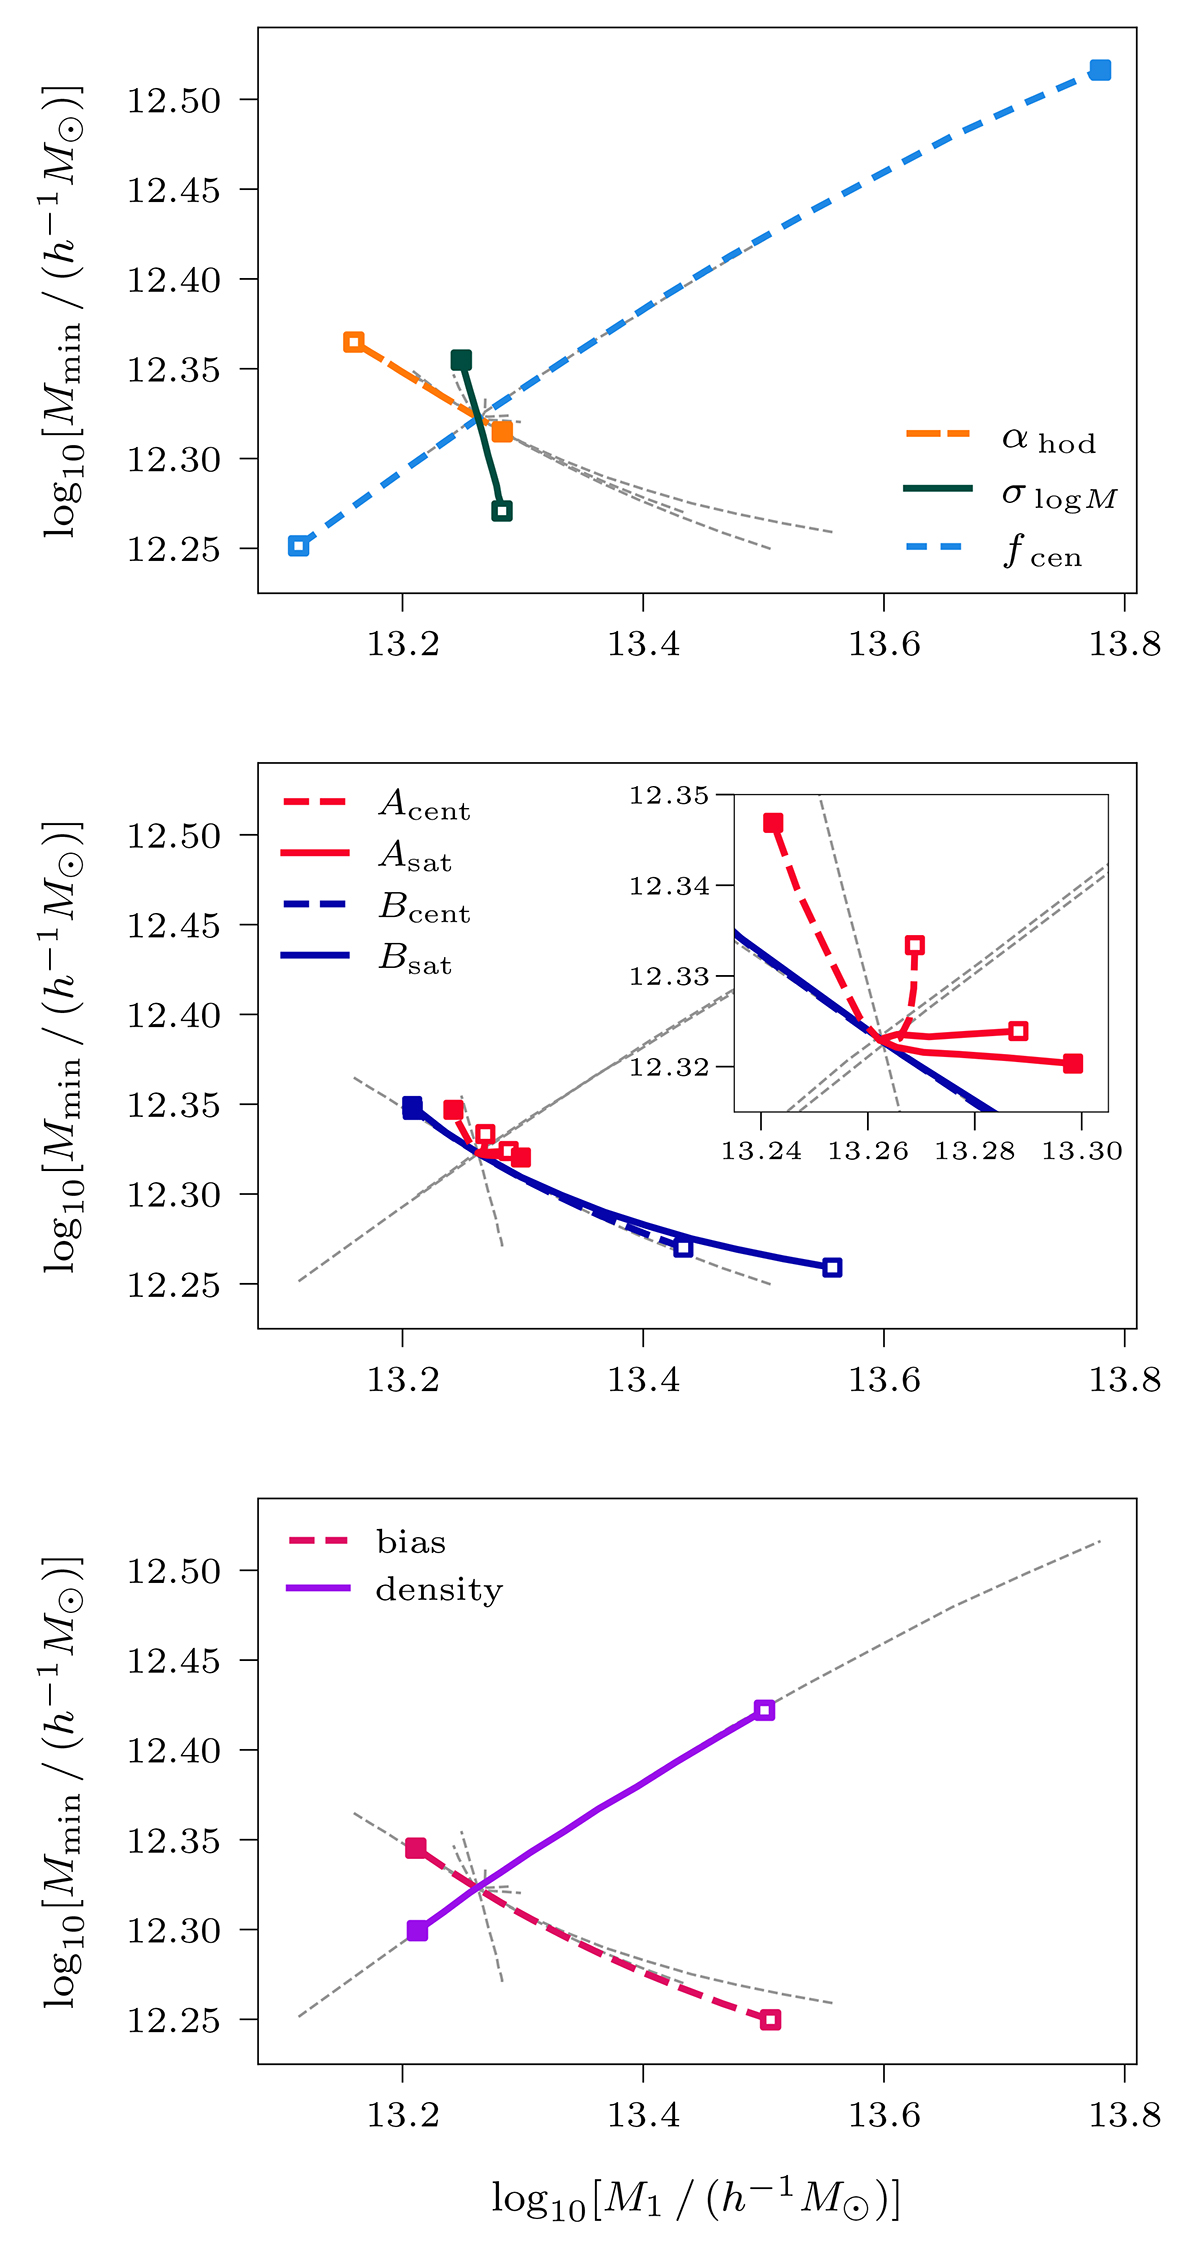
Fig. 3.
Download original image
Mmin versus M1 for the HODs produced when one non-mass parameter is varied and M1 and Mmin are optimized to achieve the target bias and density. The ends of each curve are marked with an open square for the lowest value of that parameter and a filled square for the highest (see Table 1 for the parameter ranges). All HOD curves intersect at the location of the baseline model. Top panel: HODs that vary the parameters αhod, σlog M, and fcen. Middle panel: HODs that vary the assembly bias parameters Acent, Asat, Bcent, and Bsat (inset: closeup of the curves for Acent and Asat). Bottom panel: HODs that vary the target values of bias and density while keeping the non-mass parameters fixed at baseline. Gray dashed curves in each panel correspond to the curves from the other two panels for reference.
Current usage metrics show cumulative count of Article Views (full-text article views including HTML views, PDF and ePub downloads, according to the available data) and Abstracts Views on Vision4Press platform.
Data correspond to usage on the plateform after 2015. The current usage metrics is available 48-96 hours after online publication and is updated daily on week days.
Initial download of the metrics may take a while.