Fig. 2.
Download original image
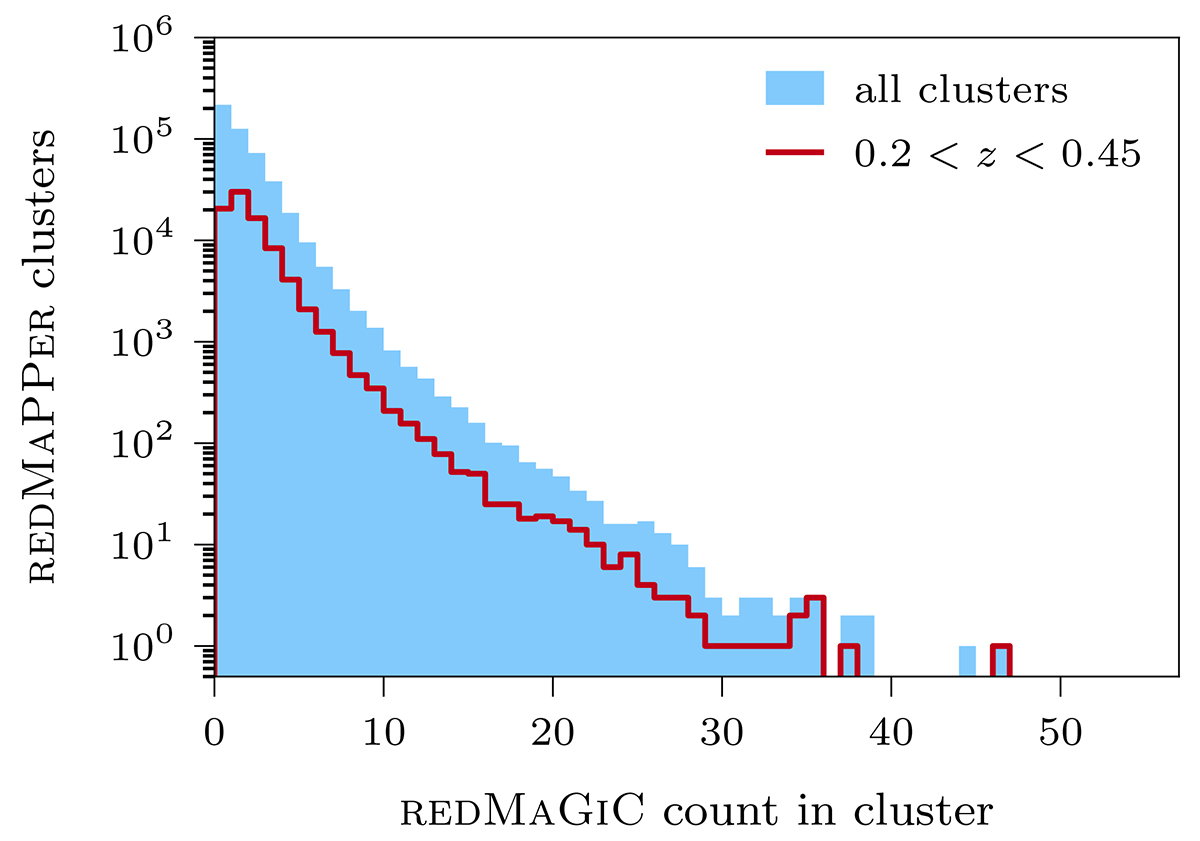
Distribution of counts of DES Y3GOLD REDMAGIC galaxies (high-density sample) in REDMAPPER clusters. Count per cluster is calculated as the sum of membership probabilities for all REDMAGIC galaxies identified as possible members of the cluster. Shown are the distributions for all clusters in the catalog (blue) and for clusters in the redshift range 0.2 < z < 0.45 (red); this is identical to the range used in the density split analysis of DES Y1 REDMAGIC galaxies in Gruen et al. (2018).
Current usage metrics show cumulative count of Article Views (full-text article views including HTML views, PDF and ePub downloads, according to the available data) and Abstracts Views on Vision4Press platform.
Data correspond to usage on the plateform after 2015. The current usage metrics is available 48-96 hours after online publication and is updated daily on week days.
Initial download of the metrics may take a while.