Fig. 1.

Download original image
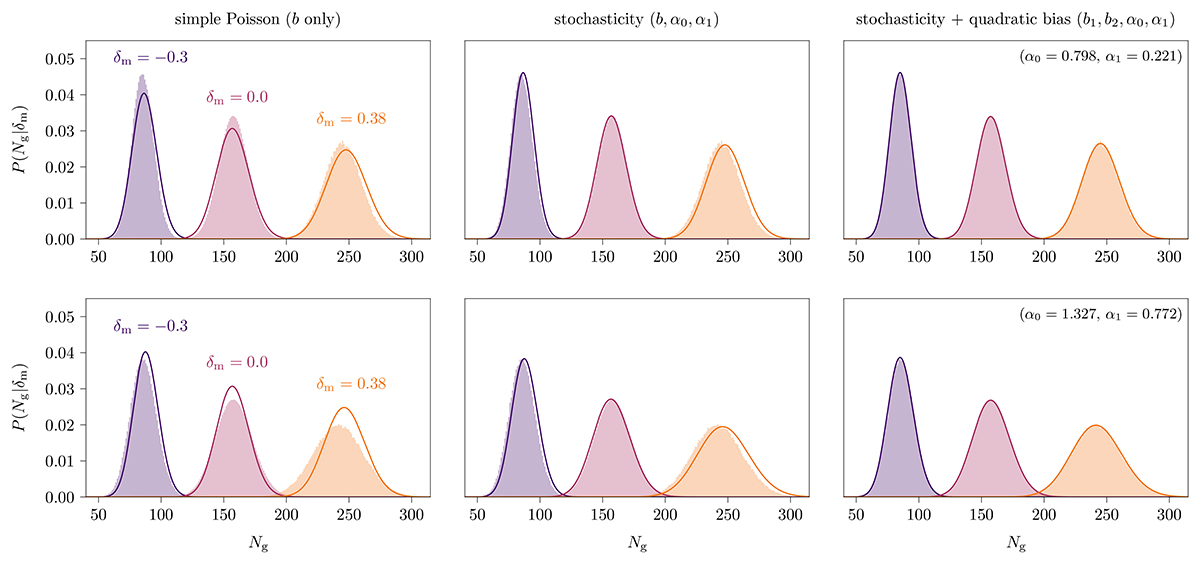
Comparison of different model predictions for P(Ng | δm) against measured counts-in-cells distributions in mock galaxy catalogs for a pair of example HODs that have sub-Poisson scatter (top row) and super-Poisson scatter (bottom row) at δm = 0. Within each row, the three panels show model fits (solid curves) for the different parametrizations of P(Ng | δm) given in Eqs. (1), (2), and (4). Left column: Best-fitting model with linear bias only; i.e., a simple Poisson distribution. Middle column: Model with linear bias b and density-dependent stochasticity α0, α1, which decouples the mean and variance of the distribution. Right column: Stochasticity model with galaxy bias modeled to second order in δm. Shaded histograms show the measured distributions of galaxy counts in cells for three narrow bins of width 0.05 in δm. Each histogram is an average over 200 mock galaxy catalogs. The underdense (−0.3) and overdense (0.38) bins are set to the most extreme values of δm for which each bin still contains at least 1000 of the 160 000 cylinders in the simulation box. Stochasticity values α0 and α1 for the two HODs (as measured in the model with quadratic bias) are given in the top right corner of the last panel in each row.
Current usage metrics show cumulative count of Article Views (full-text article views including HTML views, PDF and ePub downloads, according to the available data) and Abstracts Views on Vision4Press platform.
Data correspond to usage on the plateform after 2015. The current usage metrics is available 48-96 hours after online publication and is updated daily on week days.
Initial download of the metrics may take a while.


