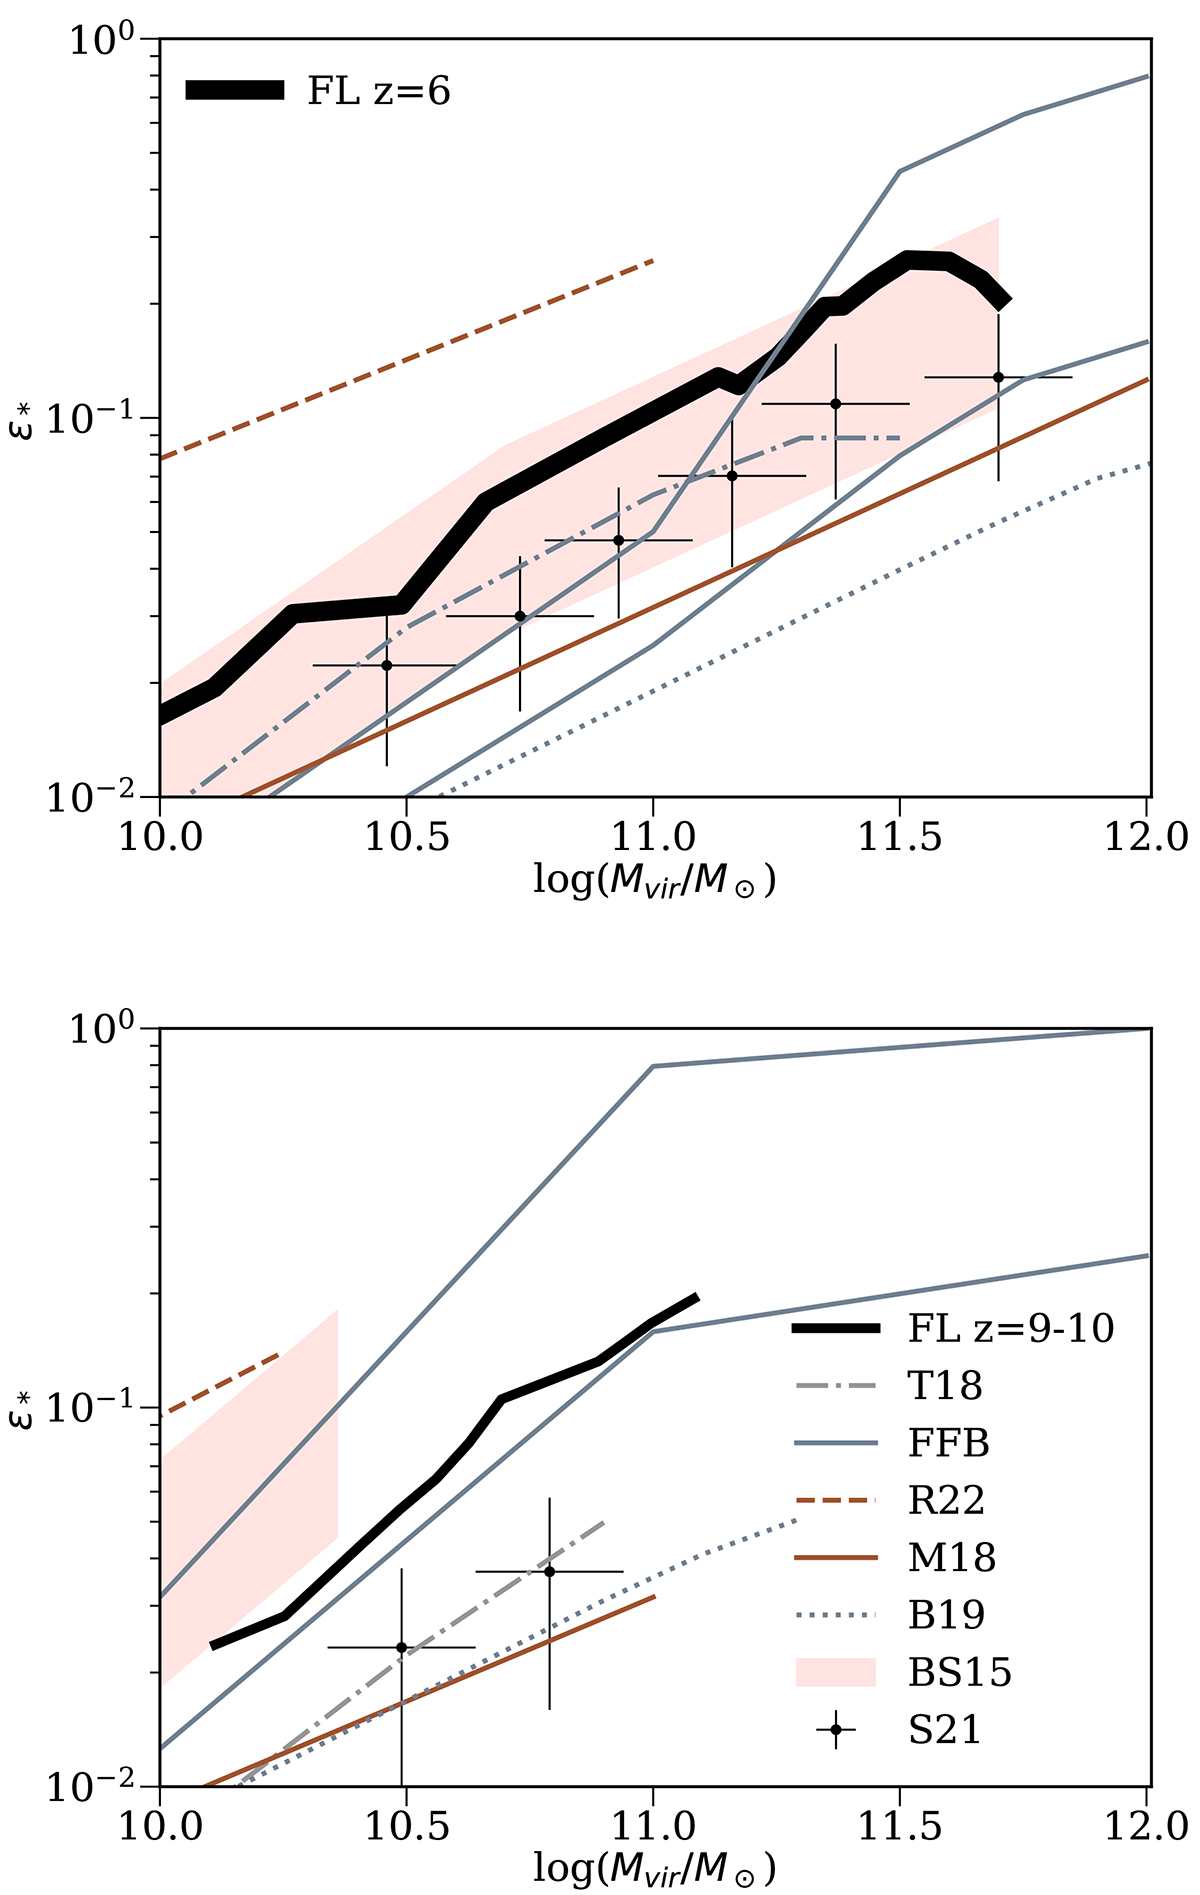
Fig. 7.
Download original image
Comparison of the integrated efficiency at z = 6 (top) and z ≃ 9 (bottom) between FirstLight (solid black lines, as in Figure 5), pre-JWST observations by Stefanon et al. (2021) (points with error bars), SPHINX (dashed) and FIRE-2 (solid) simulations, and semi-empirical models by Behroozi & Silk (2015) (red contour), Tacchella et al. (2018) (dot-dashed), Behroozi et al. (2019) (dotted), and Li et al. (2024) models of FFB with ϵmax = 0.2 and 1 (solid grey lines).
Current usage metrics show cumulative count of Article Views (full-text article views including HTML views, PDF and ePub downloads, according to the available data) and Abstracts Views on Vision4Press platform.
Data correspond to usage on the plateform after 2015. The current usage metrics is available 48-96 hours after online publication and is updated daily on week days.
Initial download of the metrics may take a while.