Fig. 5.
Download original image
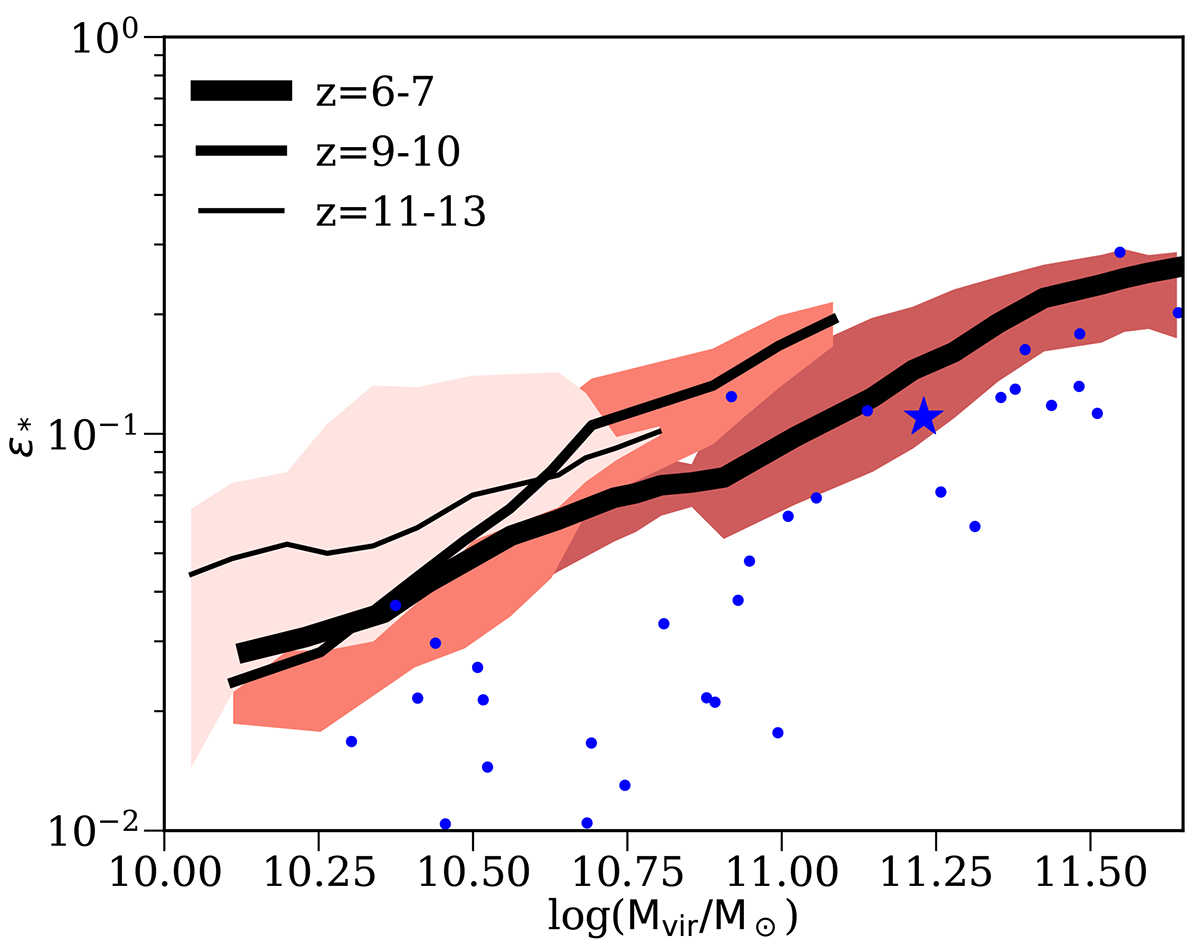
Integrated galaxy formation efficiency, ϵ* = M*/(MvirfB), at different redshifts. The lines are the same as in Fig. fig:epsilon. Blue points represent the VELA-6 simulations (Ceverino et al. 2023) at z = 4 and the blue star represents a z = 0 galaxy from Ceverino et al. (2017b). As redshift increases, the efficiency increases at a fixed virial mass.
Current usage metrics show cumulative count of Article Views (full-text article views including HTML views, PDF and ePub downloads, according to the available data) and Abstracts Views on Vision4Press platform.
Data correspond to usage on the plateform after 2015. The current usage metrics is available 48-96 hours after online publication and is updated daily on week days.
Initial download of the metrics may take a while.