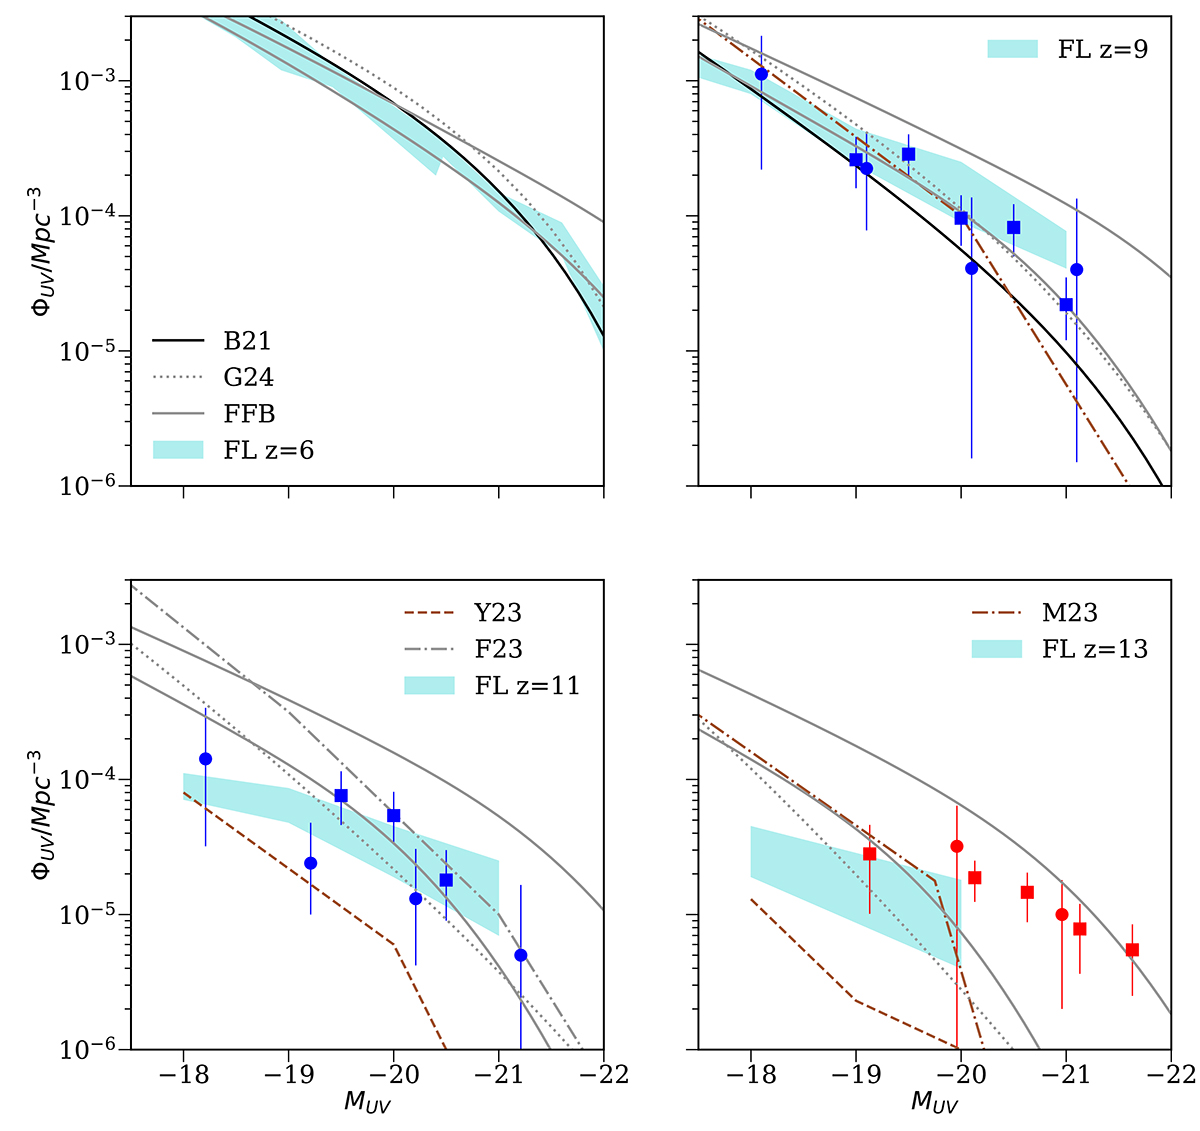
Fig. 2.
Download original image
Evolution of the UV luminosity function from z = 6 to z = 13. The cyan regions represent the FirstLight simulations with Poisson uncertainties. JWST observations are marked by blue circles (Harikane et al. 2023), blue squares (Finkelstein et al. 2024), red circles (Bouwens et al. 2022), and red squares (Yan et al. 2023). Pre-JWST observations are shown by black lines (Bouwens et al. 2021). The fiducial models by Ferrara et al. (2023) (grey dash-dotted line), Yung et al. (2023) (brown dashed lines), Mauerhofer & Dayal (2023) (brown dash-dotted lines), and Gelli et al. (2024) (gray dotted lines) fail to reproduce JWST observations at z ≥ 9. FirstLight results lie in between FFB models with ϵmax = 0.2 and 1 (gray solid lines).
Current usage metrics show cumulative count of Article Views (full-text article views including HTML views, PDF and ePub downloads, according to the available data) and Abstracts Views on Vision4Press platform.
Data correspond to usage on the plateform after 2015. The current usage metrics is available 48-96 hours after online publication and is updated daily on week days.
Initial download of the metrics may take a while.