Fig. 7
Download original image
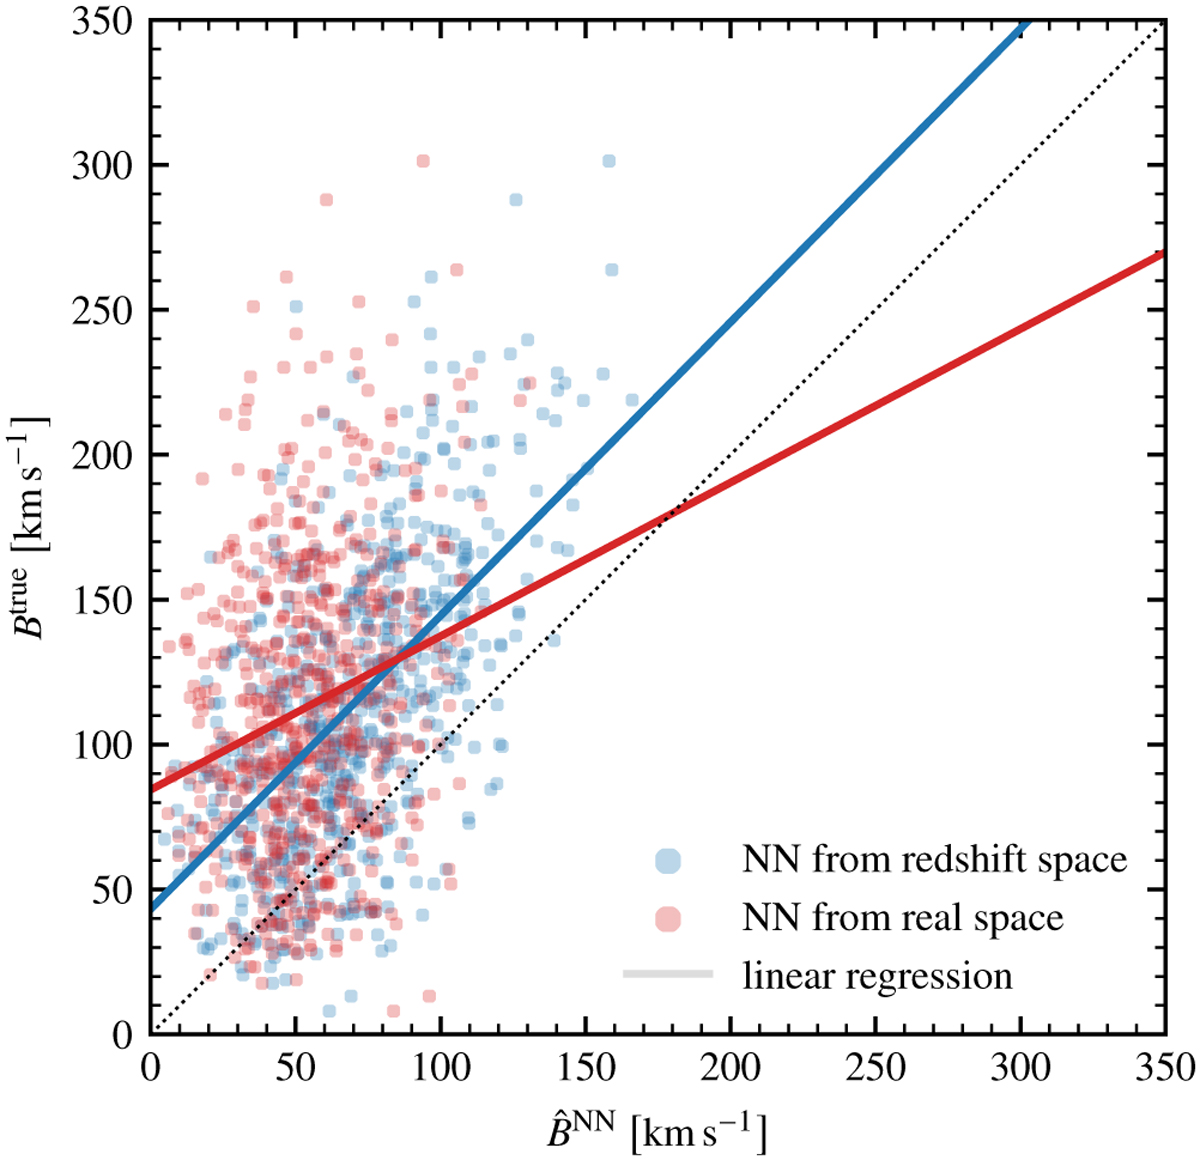
Scatter of true versus NN-reconstructed bulk flow amplitudes of the total survey volume using reconstructions from observations in redshift space (blue) and real space (red) in the validation mocks. The solid lines show the linear regression of true on reconstructed values, with slopes of 1.01 and 0.53 for redshift-space and real-space observations, respectively. For reference, the diagonal is marked with a dotted line.
Current usage metrics show cumulative count of Article Views (full-text article views including HTML views, PDF and ePub downloads, according to the available data) and Abstracts Views on Vision4Press platform.
Data correspond to usage on the plateform after 2015. The current usage metrics is available 48-96 hours after online publication and is updated daily on week days.
Initial download of the metrics may take a while.