Fig. 6
Download original image
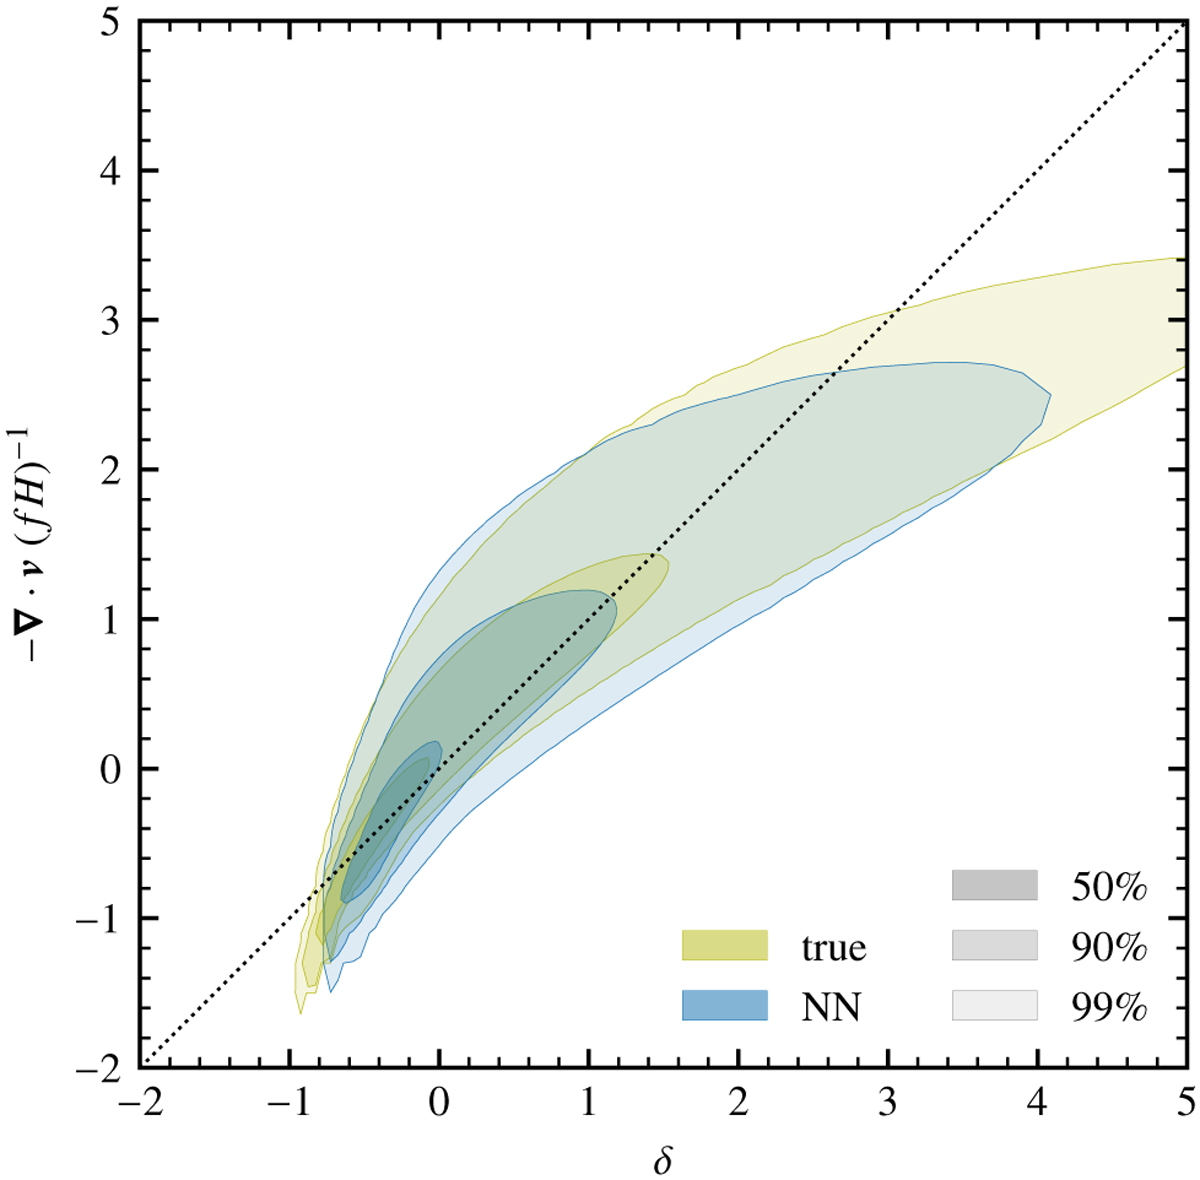
Distributions of velocity divergence versus density contrast values for the true (green) and NN-reconstructed (blue) fields in the validation mocks. They are represented as shaded areas bounded by the iso-density contours of the distribution. Going from a darker to lighter hue, the shaded areas contain 50, 90, and 99% of all the points, respectively. The velocity divergence values are rescaled such that the diagonal dotted line marks the linear theory prediction.
Current usage metrics show cumulative count of Article Views (full-text article views including HTML views, PDF and ePub downloads, according to the available data) and Abstracts Views on Vision4Press platform.
Data correspond to usage on the plateform after 2015. The current usage metrics is available 48-96 hours after online publication and is updated daily on week days.
Initial download of the metrics may take a while.