Fig. 5
Download original image
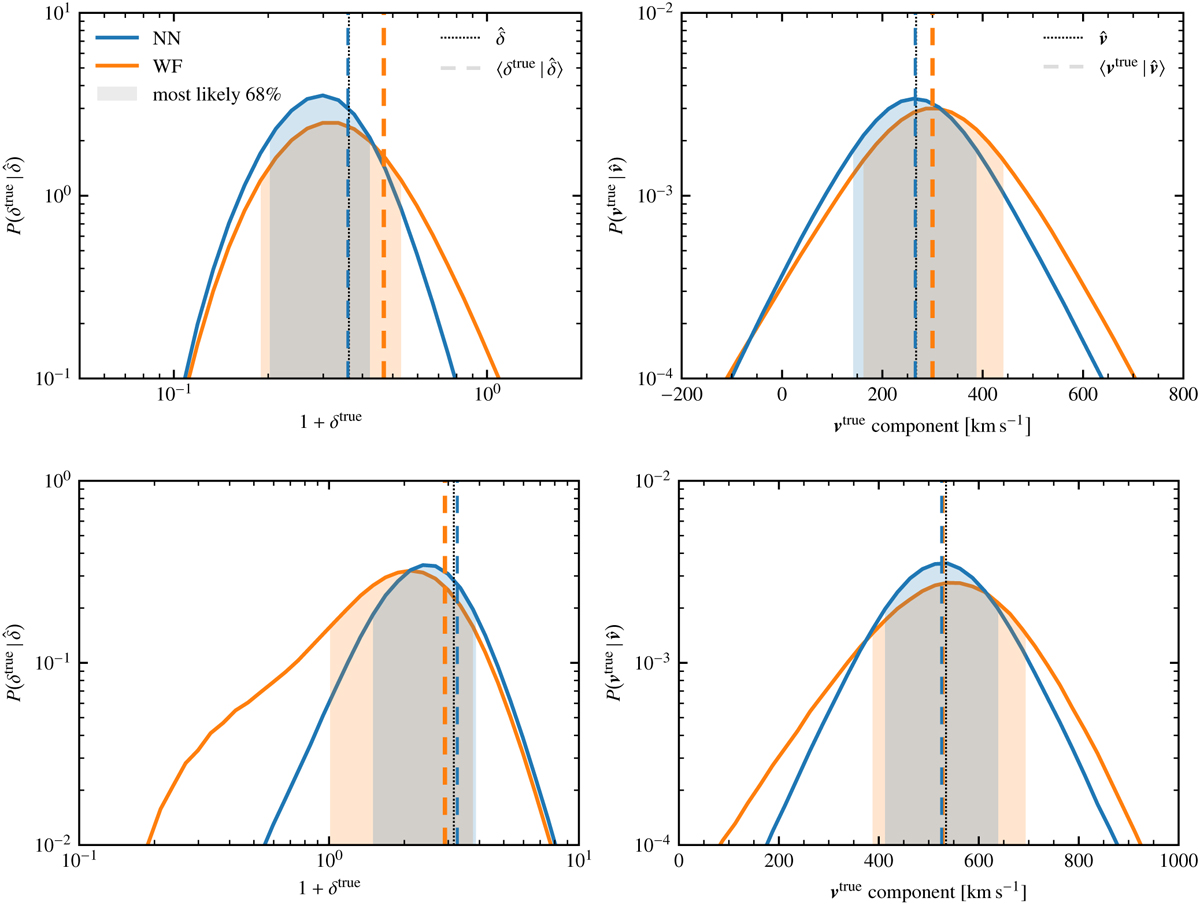
Conditional distributions of true given reconstructed field values. Top-left panel: conditional distribution of true densities for a given reconstructed density ![]() (marked by the vertical dotted line) for NN (blue) and WF (orange) in the validation mocks. The conditional mean true values and the 68% most likely true values are shown as vertical dashed lines and shaded ares, respectively. Top-right panel: same for the peculiar velocity components for a given reconstructed velocity component of
(marked by the vertical dotted line) for NN (blue) and WF (orange) in the validation mocks. The conditional mean true values and the 68% most likely true values are shown as vertical dashed lines and shaded ares, respectively. Top-right panel: same for the peculiar velocity components for a given reconstructed velocity component of ![]() . Bottom row: same for
. Bottom row: same for ![]() and a component of
and a component of ![]() .
.
Current usage metrics show cumulative count of Article Views (full-text article views including HTML views, PDF and ePub downloads, according to the available data) and Abstracts Views on Vision4Press platform.
Data correspond to usage on the plateform after 2015. The current usage metrics is available 48-96 hours after online publication and is updated daily on week days.
Initial download of the metrics may take a while.