Fig. 4
Download original image
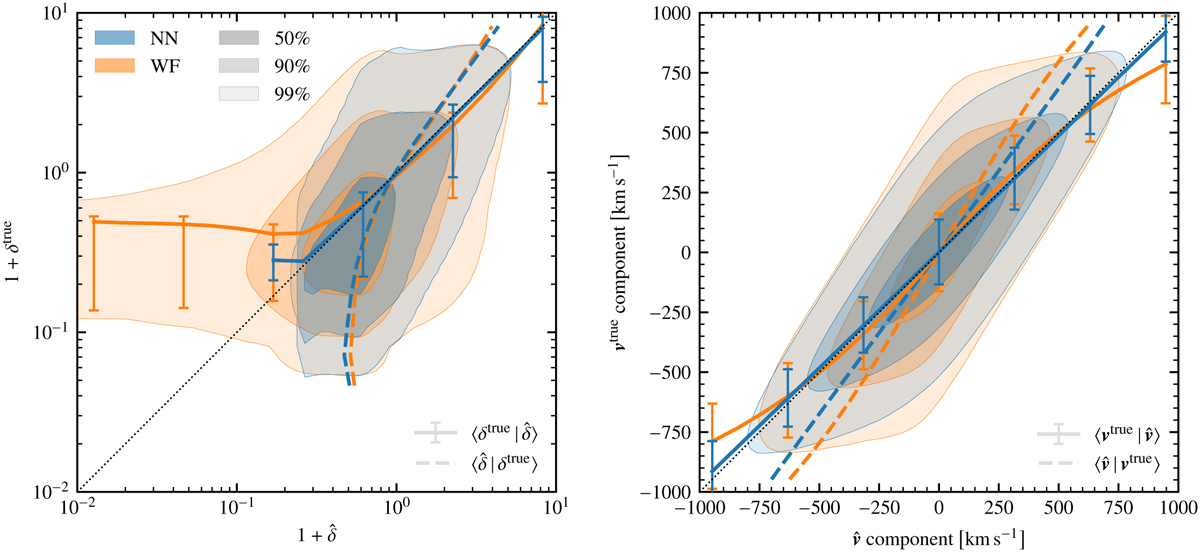
Distribution of true versus reconstructed field values. Left panel: distribution of true versus reconstructed density values for the NN (blue) and WF (orange) reconstructions in the validation mocks, represented as shaded areas bounded by the iso-density contours of the distribution. Going from a darker to lighter hue, the shaded areas contain 50, 90, and 99% of all the points, respectively. The conditional mean true values and the 68% most likely true values for a given reconstructed value are shown as solid lines and error bars, respectively. The average reconstructed values for a given true value are shown as dashed lines (understood as a function of the true values). For reference, the diagonal is marked with a dotted line. Right panel: same for the peculiar velocity components.
Current usage metrics show cumulative count of Article Views (full-text article views including HTML views, PDF and ePub downloads, according to the available data) and Abstracts Views on Vision4Press platform.
Data correspond to usage on the plateform after 2015. The current usage metrics is available 48-96 hours after online publication and is updated daily on week days.
Initial download of the metrics may take a while.