Fig. 3
Download original image
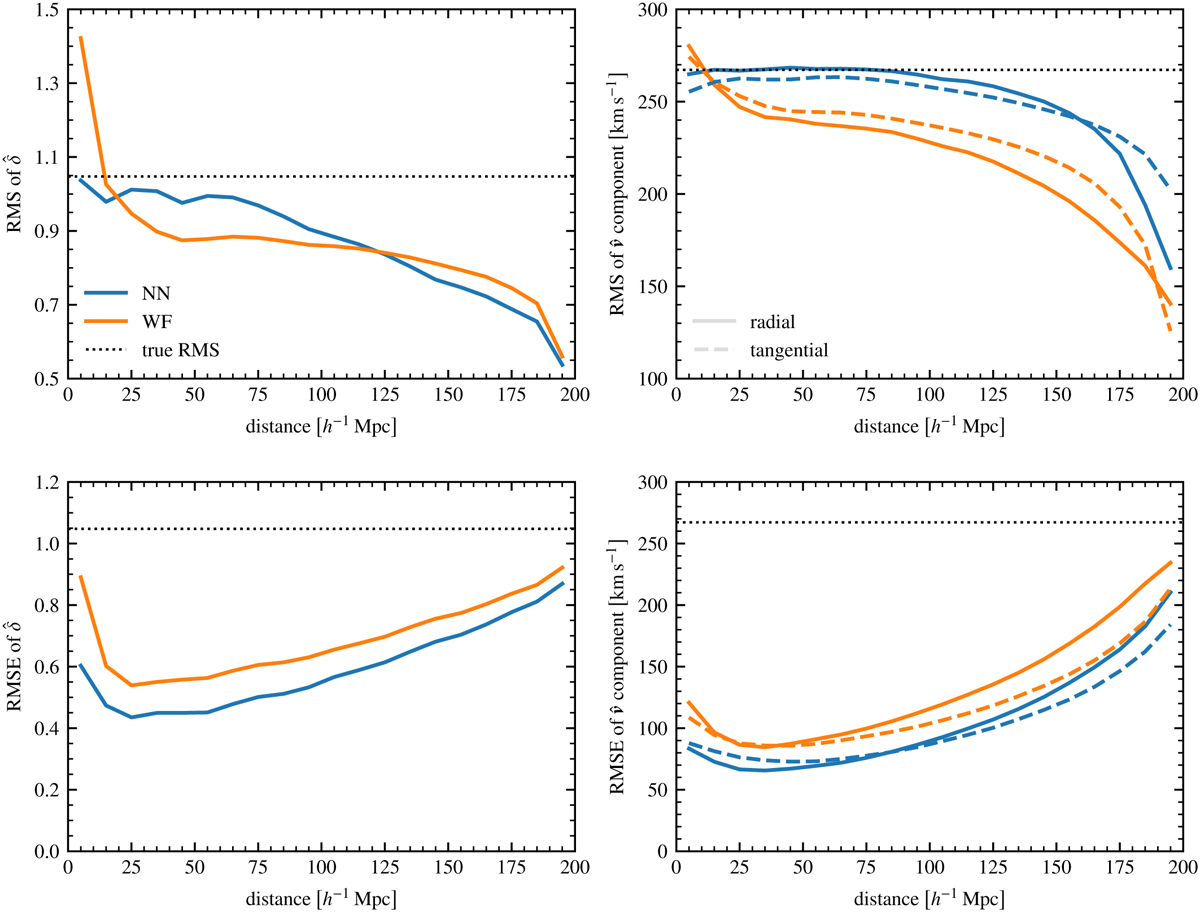
Root mean square (top) and root mean squared error (bottom) of the reconstructed fields as a function of distance. Top-left panel: root mean square of the reconstructed density contrast for the NN (blue) and WF (orange) in the validation mocks. The RMS is averaged over spherical shells of width 10 h−1 Mpc. For reference, the RMS of the true field is marked by the horizontal dotted line. Top-right panel: same for the radial (solid) and tangential (dashed) peculiar velocity components. Bottom row: same for the root mean squared error.
Current usage metrics show cumulative count of Article Views (full-text article views including HTML views, PDF and ePub downloads, according to the available data) and Abstracts Views on Vision4Press platform.
Data correspond to usage on the plateform after 2015. The current usage metrics is available 48-96 hours after online publication and is updated daily on week days.
Initial download of the metrics may take a while.