Fig. 2
Download original image
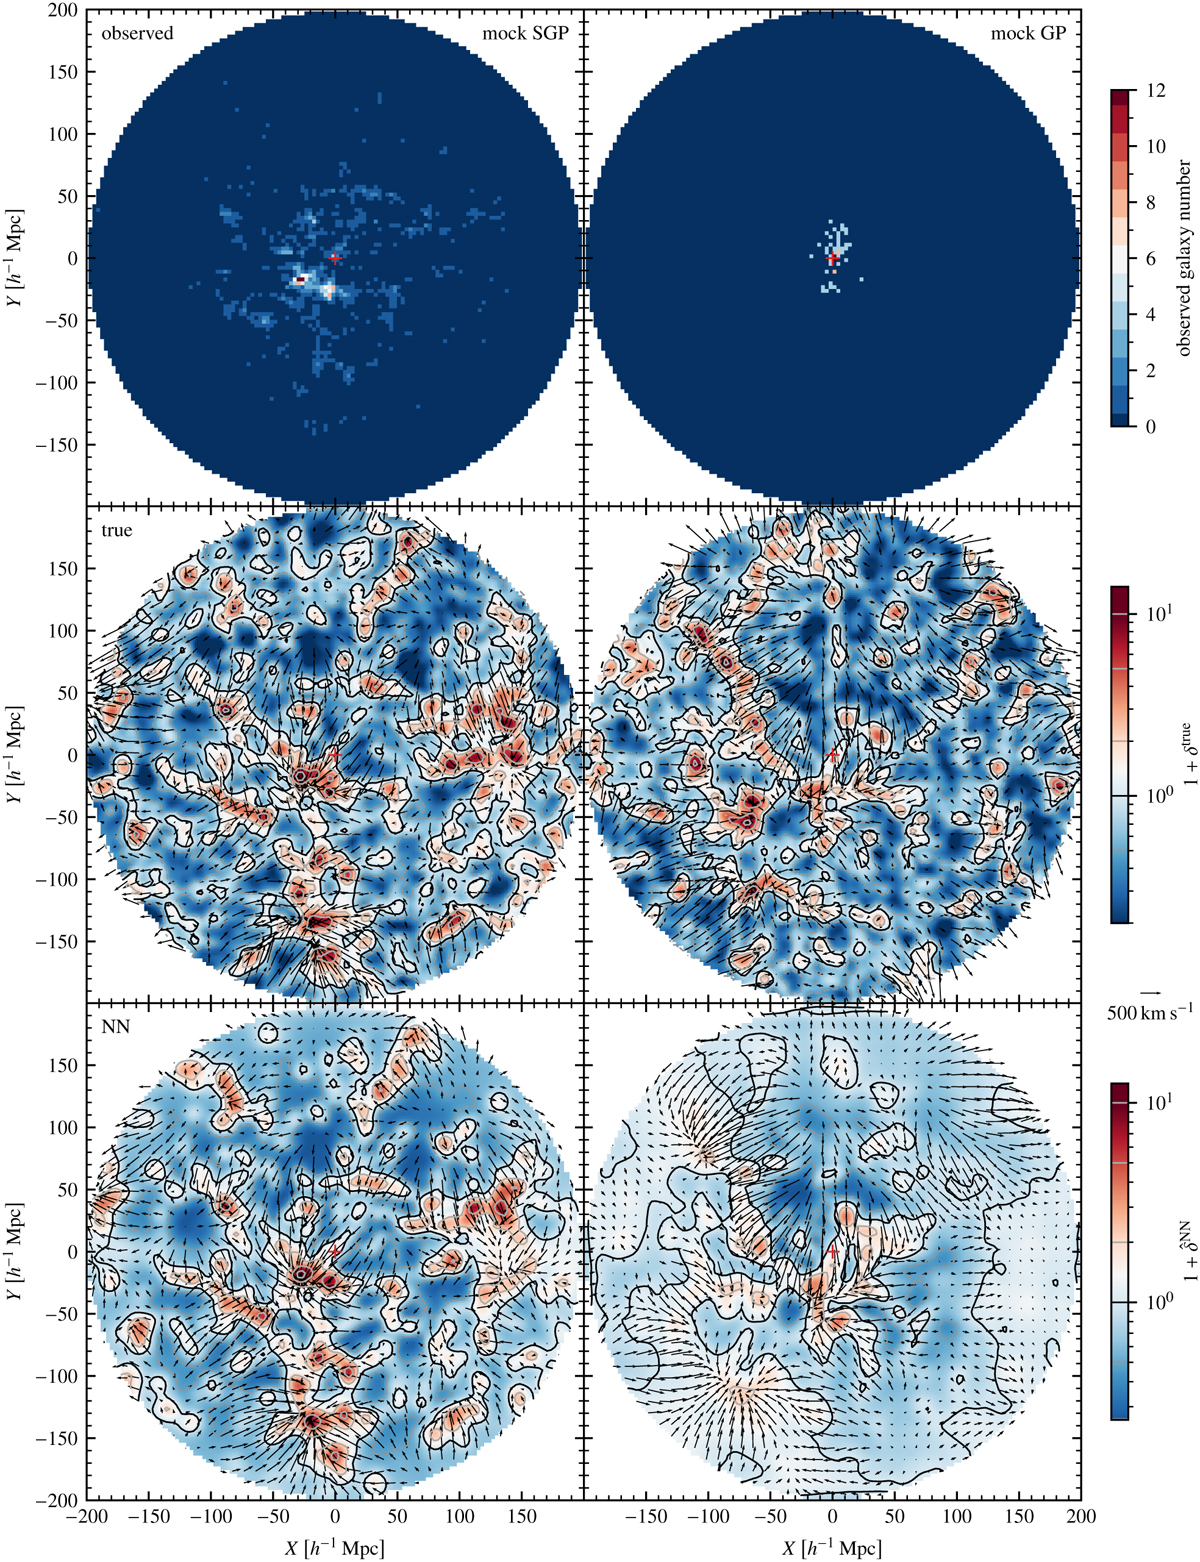
Observed, true and reconstructed fields in a slice through the Supergalactic (left) and Galactic (right) planes for one of the validation mocks. Top row: observed galaxy numbers. The red cross marks the position of the observer at the origin. Middle row: true density (heat map and contours) and peculiar velocity (arrows) fields. The values represented by the contours are marked in the color bar. A reference arrow representing a velocity of 500 km s−1 is shown on the right. Bottom row: corresponding NN-reconstructed fields.
Current usage metrics show cumulative count of Article Views (full-text article views including HTML views, PDF and ePub downloads, according to the available data) and Abstracts Views on Vision4Press platform.
Data correspond to usage on the plateform after 2015. The current usage metrics is available 48-96 hours after online publication and is updated daily on week days.
Initial download of the metrics may take a while.