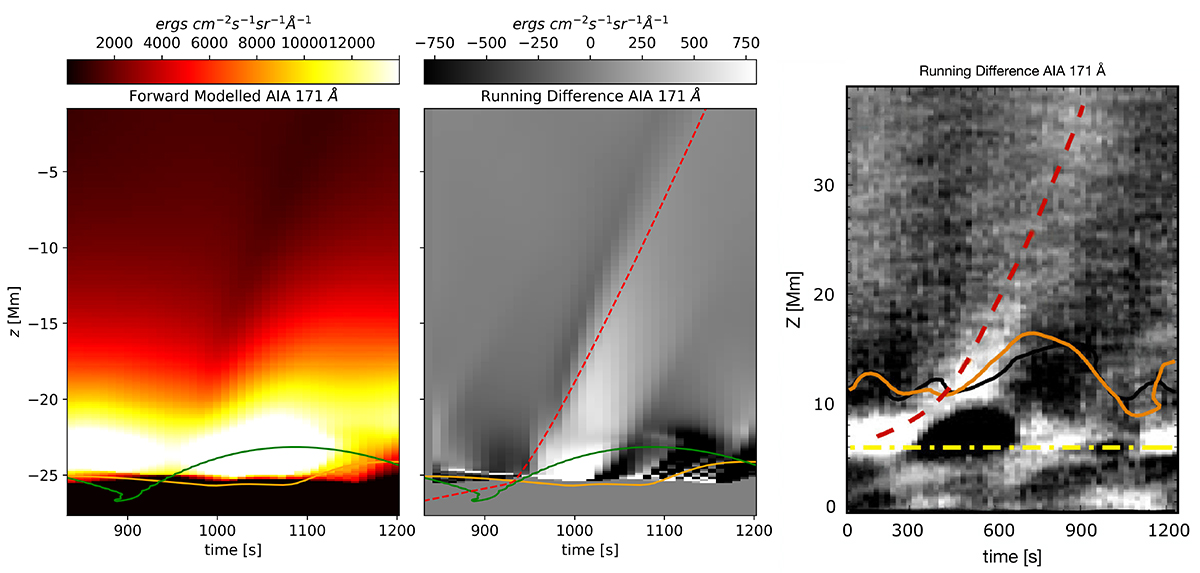
Fig. 9.
Download original image
Synthetic AIA 171 Å time-distance diagram produced using an artificial slit at r = 12.5 Mm (left). The green contour shows the location of the transition region (T = 40 000 K) in the simulation with a photospheric wave driver measured along field line 3, whereas the orange contour displays the same temperature contour using a vertical slit at r = 12.5 Mm. Running difference AIA 171 Å highlighting the nature of the PD in the simulation (middle). The red dashed line highlights the trajectory of the sound speed in the simulation domain. Observation from Samanta et al. (2015) of AIA 171 Å running difference where the orange and black contours outline the height of the transition region using observations from IRIS 2796 Å and IRIS 1400 Å channels (right). The red dashed line indicates the determined sound speed from the observations whereas the dashed-dot yellow line outlines the solar limb as observed in AIA instruments.
Current usage metrics show cumulative count of Article Views (full-text article views including HTML views, PDF and ePub downloads, according to the available data) and Abstracts Views on Vision4Press platform.
Data correspond to usage on the plateform after 2015. The current usage metrics is available 48-96 hours after online publication and is updated daily on week days.
Initial download of the metrics may take a while.