Open Access
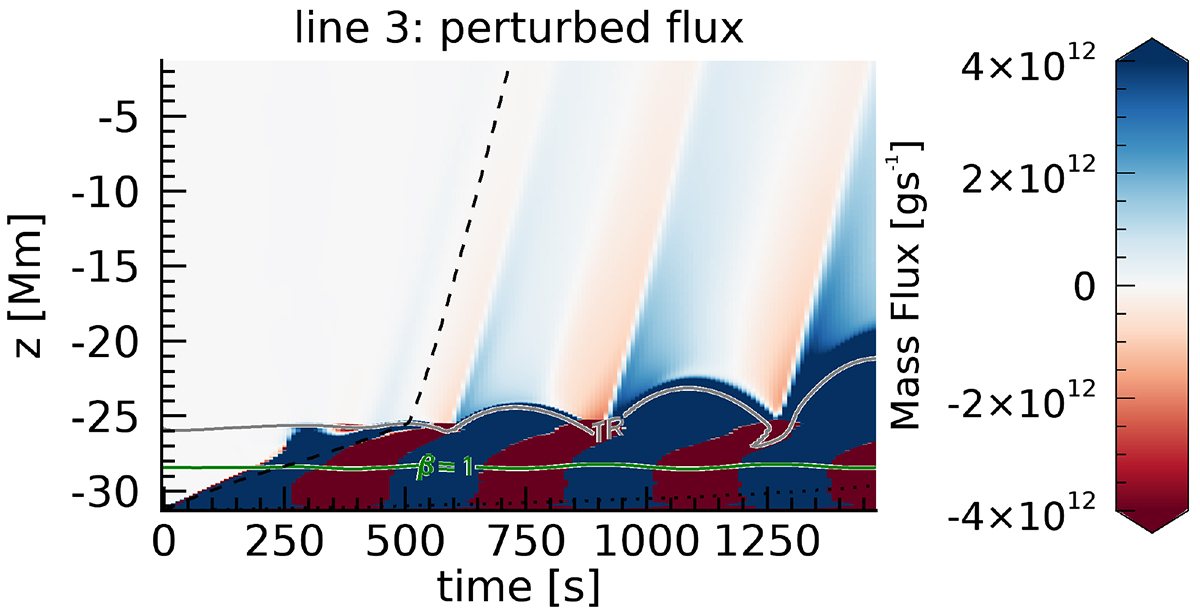
Fig. 8.
Download original image
Time-distance plot of the perturbed mass flux associated with PDs from the simulation with a wave driver along field line 3 at an azimuthal slice φ = 0 calculated using Equation (3) with the density perturbation, ![]() , determined from the simulation with a wave driver minus the simulation without a wave driver.
, determined from the simulation with a wave driver minus the simulation without a wave driver.
Current usage metrics show cumulative count of Article Views (full-text article views including HTML views, PDF and ePub downloads, according to the available data) and Abstracts Views on Vision4Press platform.
Data correspond to usage on the plateform after 2015. The current usage metrics is available 48-96 hours after online publication and is updated daily on week days.
Initial download of the metrics may take a while.