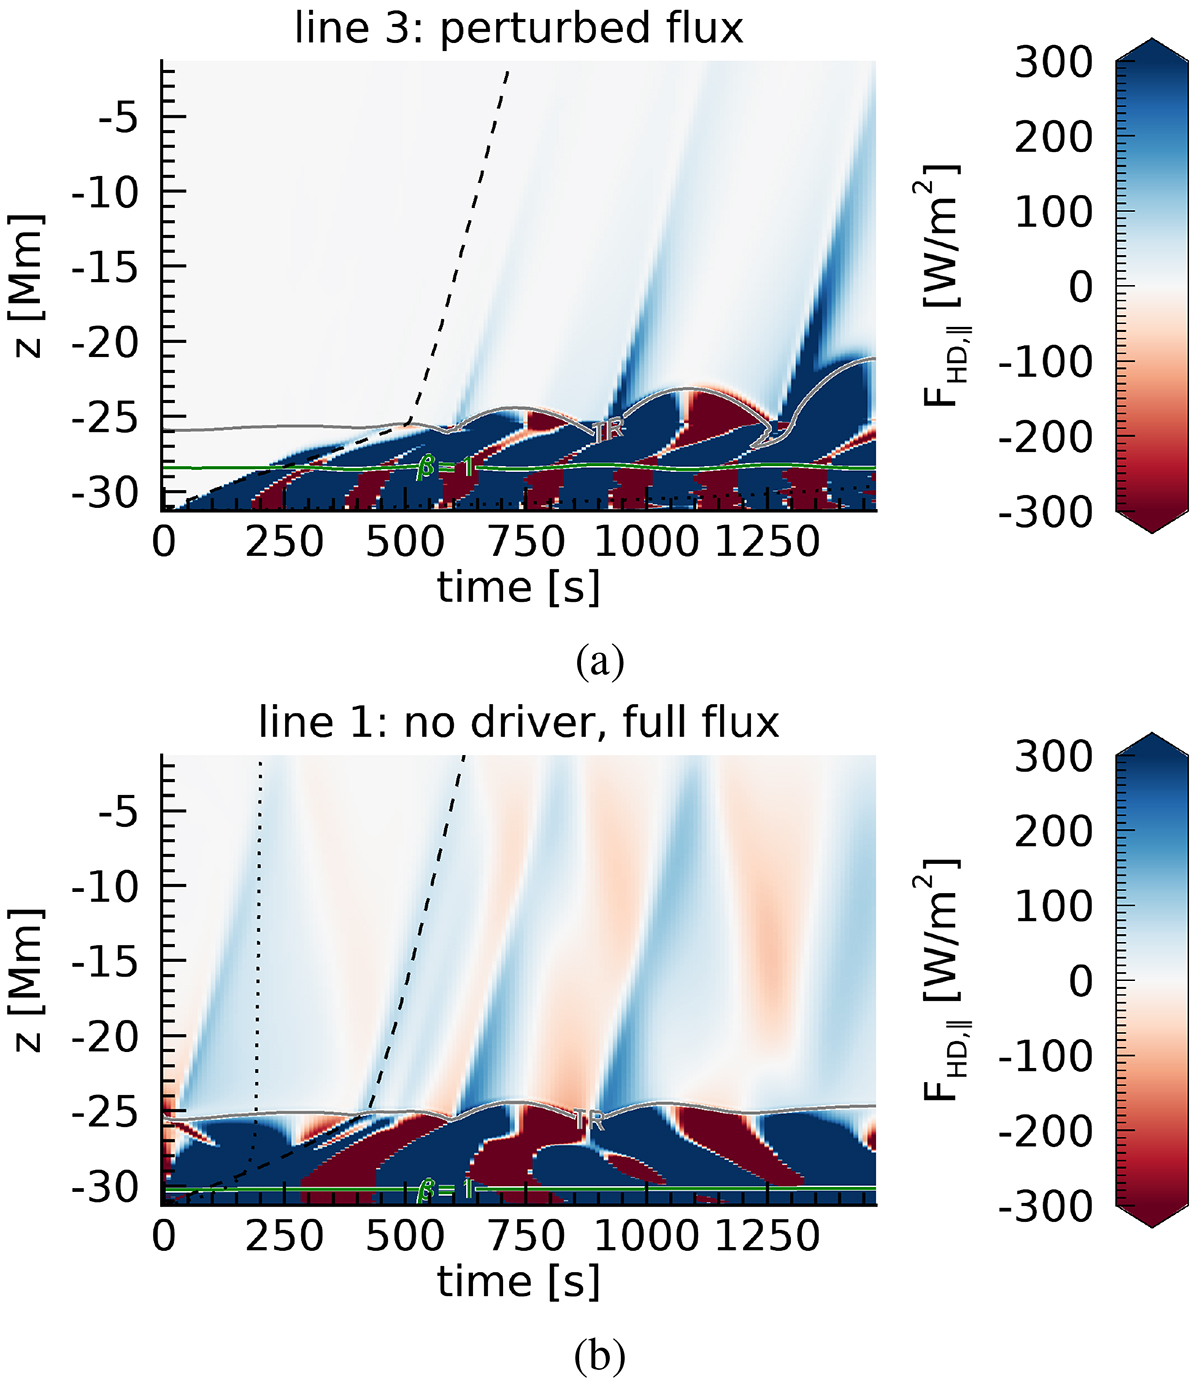
Fig. 7.
Download original image
Time-distance diagrams of (a) the perturbed hydrodynamic wave energy flux parallel to the magnetic field along field line 3 at an azimuthal slice φ = 0 for the driven simulation and (b) the total hydrodynamic wave energy flux along field line 1 for the undriven simulation. In both plots the transition region (T = 40 000 K) is denoted by the grey contour whereas the green contour outlines the β = 1 layer. The local sound speed (dashed line) and local Alfvén speed (dotted line) are also plotted on each field line.
Current usage metrics show cumulative count of Article Views (full-text article views including HTML views, PDF and ePub downloads, according to the available data) and Abstracts Views on Vision4Press platform.
Data correspond to usage on the plateform after 2015. The current usage metrics is available 48-96 hours after online publication and is updated daily on week days.
Initial download of the metrics may take a while.