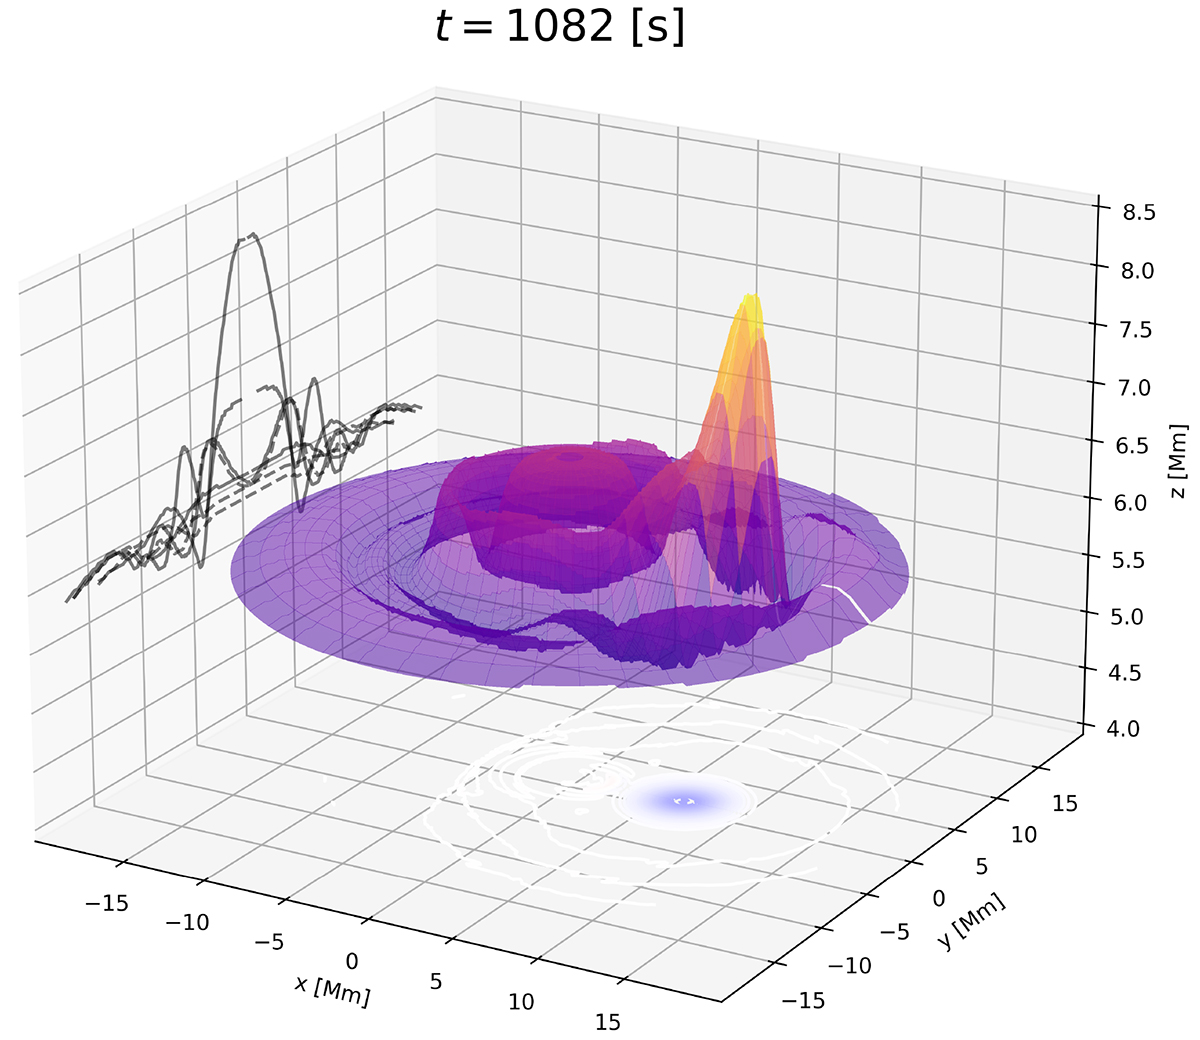
Fig. 5.

Download original image
3D representation of the height (above the bottom boundary of the simulation) of the transition region, calculated as a temperature contour of 40 000 K at a specific snapshot in time of t = 1082 s. The strength of the vz perturbation is shown on the bottom boundary plane and the shadow contour of the transition region height is projected against the y − z plane to highlight the surface waves formed at the transition region resulting from previous spicule launches.
Current usage metrics show cumulative count of Article Views (full-text article views including HTML views, PDF and ePub downloads, according to the available data) and Abstracts Views on Vision4Press platform.
Data correspond to usage on the plateform after 2015. The current usage metrics is available 48-96 hours after online publication and is updated daily on week days.
Initial download of the metrics may take a while.


