Fig. 1.
Download original image
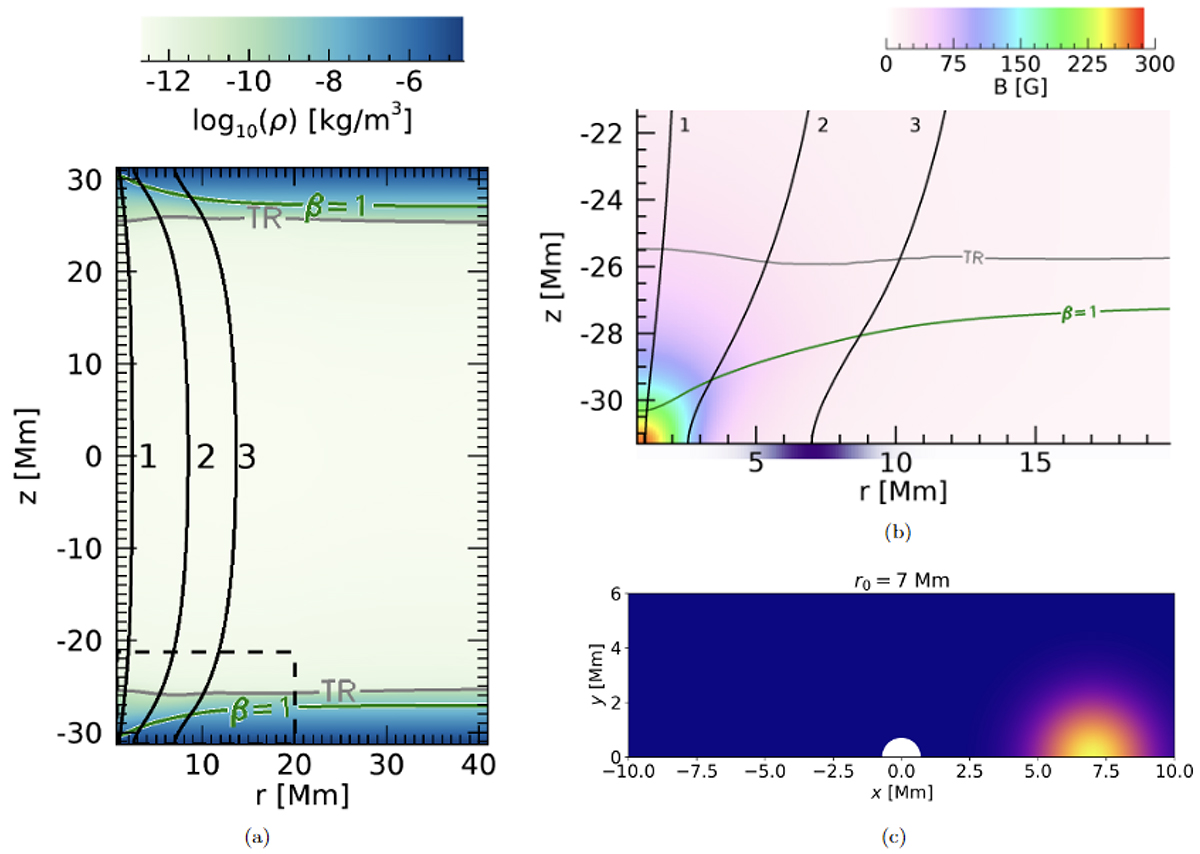
Initial background density (plotted on a log scale) in the full simulation domain at an azimuthal slice φ = 0, shown in panel a. The positions of field lines 1, 2 and 3 indicated are used for discussion in the text. Contours for the plasma-β = 1 layer and transition region are shown by the green and grey lines, respectively. Panel b shows the initial magnetic field strength and topology outlined by the black dashed box in panel a. The same configuration is found for all azimuthal angles due to the symmetry of the background equilibrium around the central axis. The location and strength of the (asymmetric) wave driver is highlighted by the purple bar on the horizontal axis. Panel c gives the location of the wave driver employed with r0 = 7 Mm (displayed on a Cartesian grid). The strength of the driver is shown in arbitrary units.
Current usage metrics show cumulative count of Article Views (full-text article views including HTML views, PDF and ePub downloads, according to the available data) and Abstracts Views on Vision4Press platform.
Data correspond to usage on the plateform after 2015. The current usage metrics is available 48-96 hours after online publication and is updated daily on week days.
Initial download of the metrics may take a while.