Open Access
Fig. 2.
Download original image
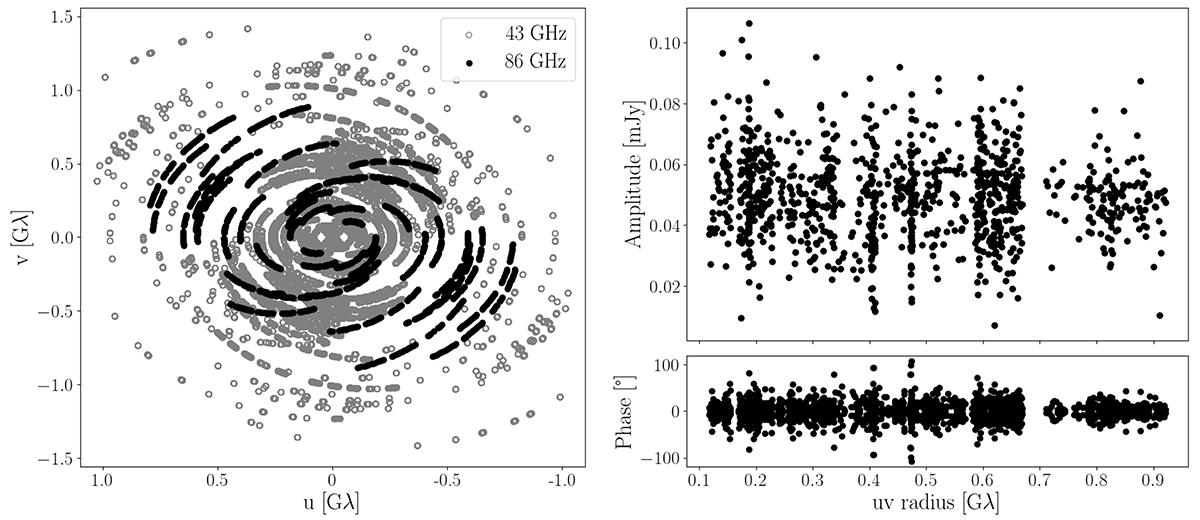
Left panel: (u, v) coverage of the 43-GHz VLBA and EF (grey) and the 86-GHz VLBA and GBT (black) observations, plotting the fringe detections. Right panel: self-calibrated amplitude and phase of the 86-GHz data set.
Current usage metrics show cumulative count of Article Views (full-text article views including HTML views, PDF and ePub downloads, according to the available data) and Abstracts Views on Vision4Press platform.
Data correspond to usage on the plateform after 2015. The current usage metrics is available 48-96 hours after online publication and is updated daily on week days.
Initial download of the metrics may take a while.