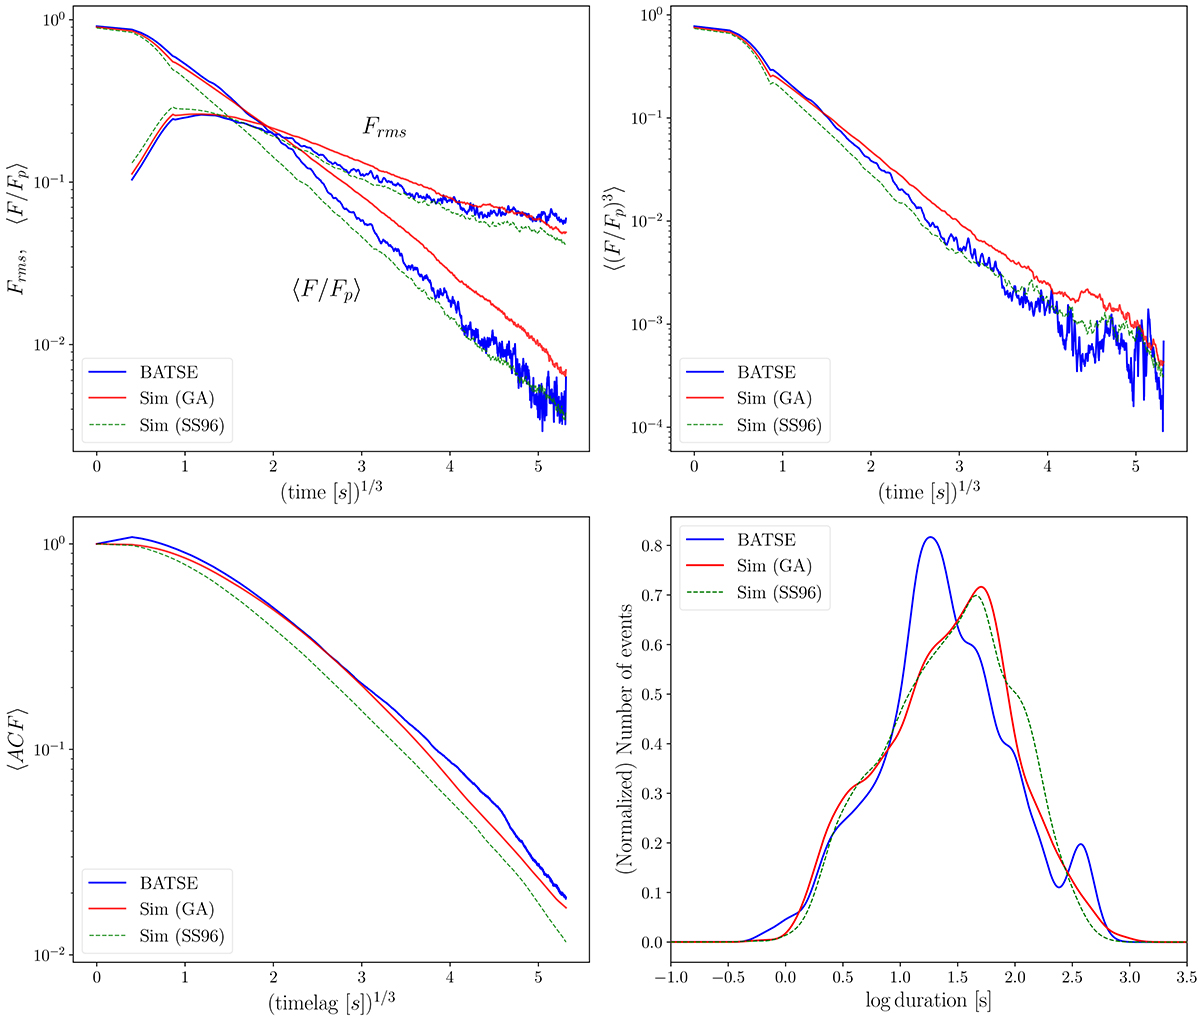
Fig. 1.
Download original image
Average distributions of real (blue), simulated GA-optimised (red), and simulated SS96 (green) BATSE GRB profiles, estimated on the test set (see Table 2). Top left: Average peak-aligned post-peak normalised time profile, together with the r.m.s. deviation of the individual peak-aligned time profiles, Frms ≡ [⟨(F/Fp)2⟩−⟨F/Fp⟩2]1/2. Top right: Average peak-aligned third moment test. Bottom left: Average ACF of the GRBs. Bottom right: Distribution of duration, measured at a level of 20% of the peak amplitude (T20%). In the top left and top right panels, both real and simulated averaged curves were smoothed with a Savitzky-Golay filter to reduce the effect of Poisson noise. In the bottom right panel, a Gaussian kernel convolution has been applied to both real and simulated distributions.
Current usage metrics show cumulative count of Article Views (full-text article views including HTML views, PDF and ePub downloads, according to the available data) and Abstracts Views on Vision4Press platform.
Data correspond to usage on the plateform after 2015. The current usage metrics is available 48-96 hours after online publication and is updated daily on week days.
Initial download of the metrics may take a while.