Fig. 9.
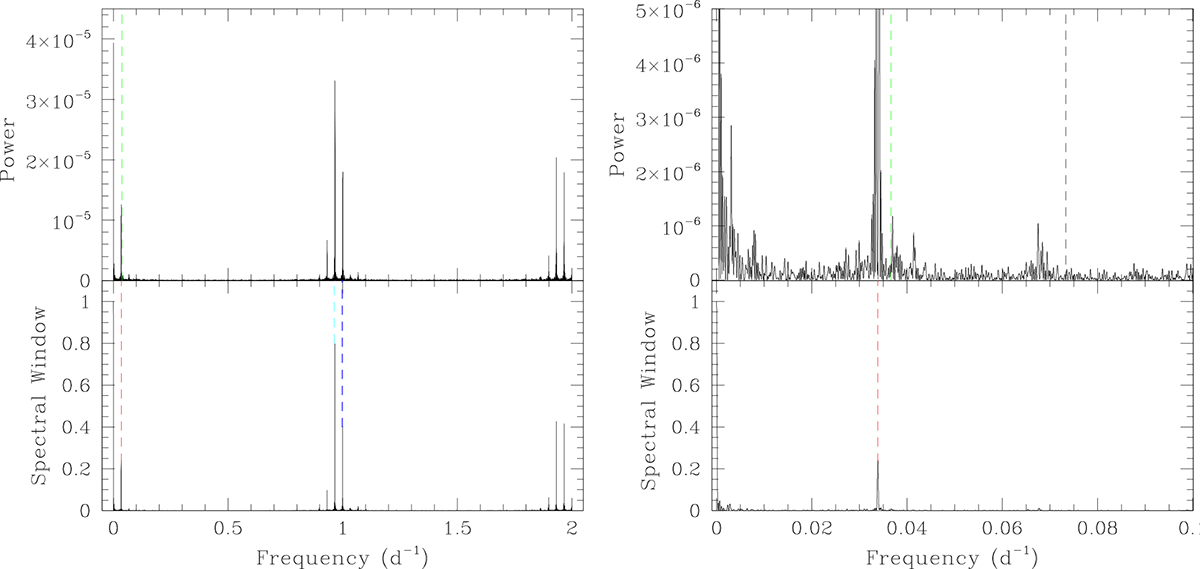
Download original image
Fourier power spectrum (top-left) and spectral window (bottom-left) for the TIGRE solar S-index time series for frequencies between 0 and 2 d−1. The green dashed line in the power spectrum yields νCar, while the red, cyan and blue dashed lines in the spectral window plot identify the main aliasing frequencies which are respectively 0.0339 d−1, 0.9661 d−1, and 1.0000 d−1. Right: Same details, but zooming on the frequency range between 0 and 0.1 d−1. The dashed black line corresponds to 2νCar.
Current usage metrics show cumulative count of Article Views (full-text article views including HTML views, PDF and ePub downloads, according to the available data) and Abstracts Views on Vision4Press platform.
Data correspond to usage on the plateform after 2015. The current usage metrics is available 48-96 hours after online publication and is updated daily on week days.
Initial download of the metrics may take a while.