Open Access
Fig. 6.
Download original image
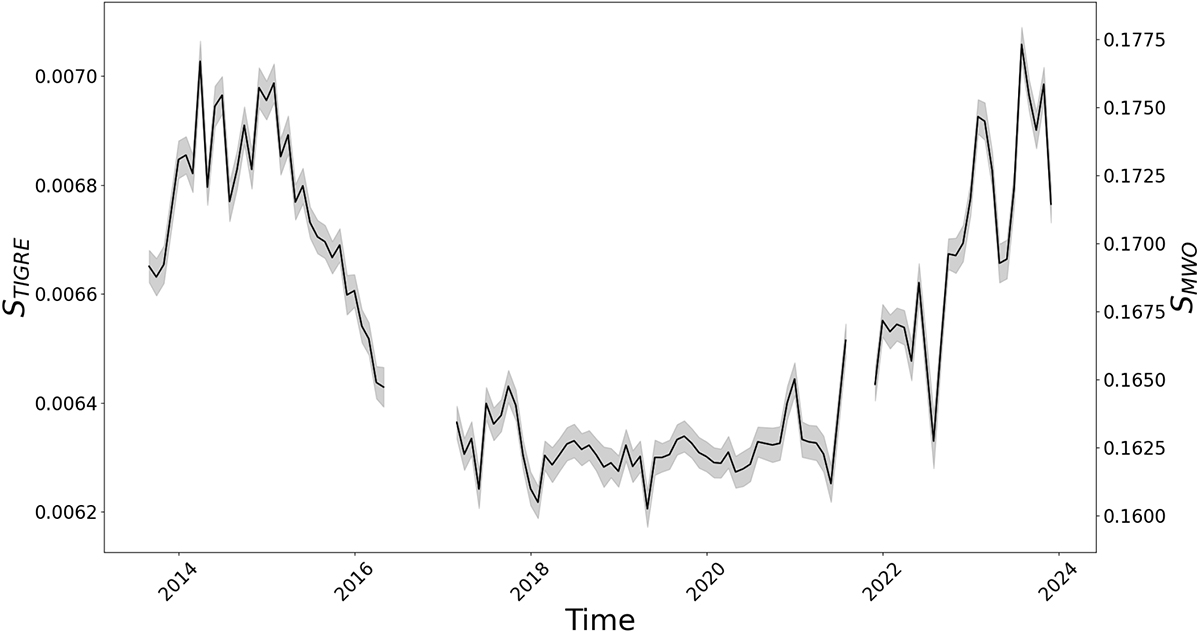
Temporal evolution of the monthly averaged solar S-index from TIGRE covering almost a complete solar cycle (from August 2013 to December 2023). Left axis displays the STIGRE values while the right axis shows them in the Mt. Wilson scale using Eq. (2).
Current usage metrics show cumulative count of Article Views (full-text article views including HTML views, PDF and ePub downloads, according to the available data) and Abstracts Views on Vision4Press platform.
Data correspond to usage on the plateform after 2015. The current usage metrics is available 48-96 hours after online publication and is updated daily on week days.
Initial download of the metrics may take a while.