Fig. 11.
Download original image
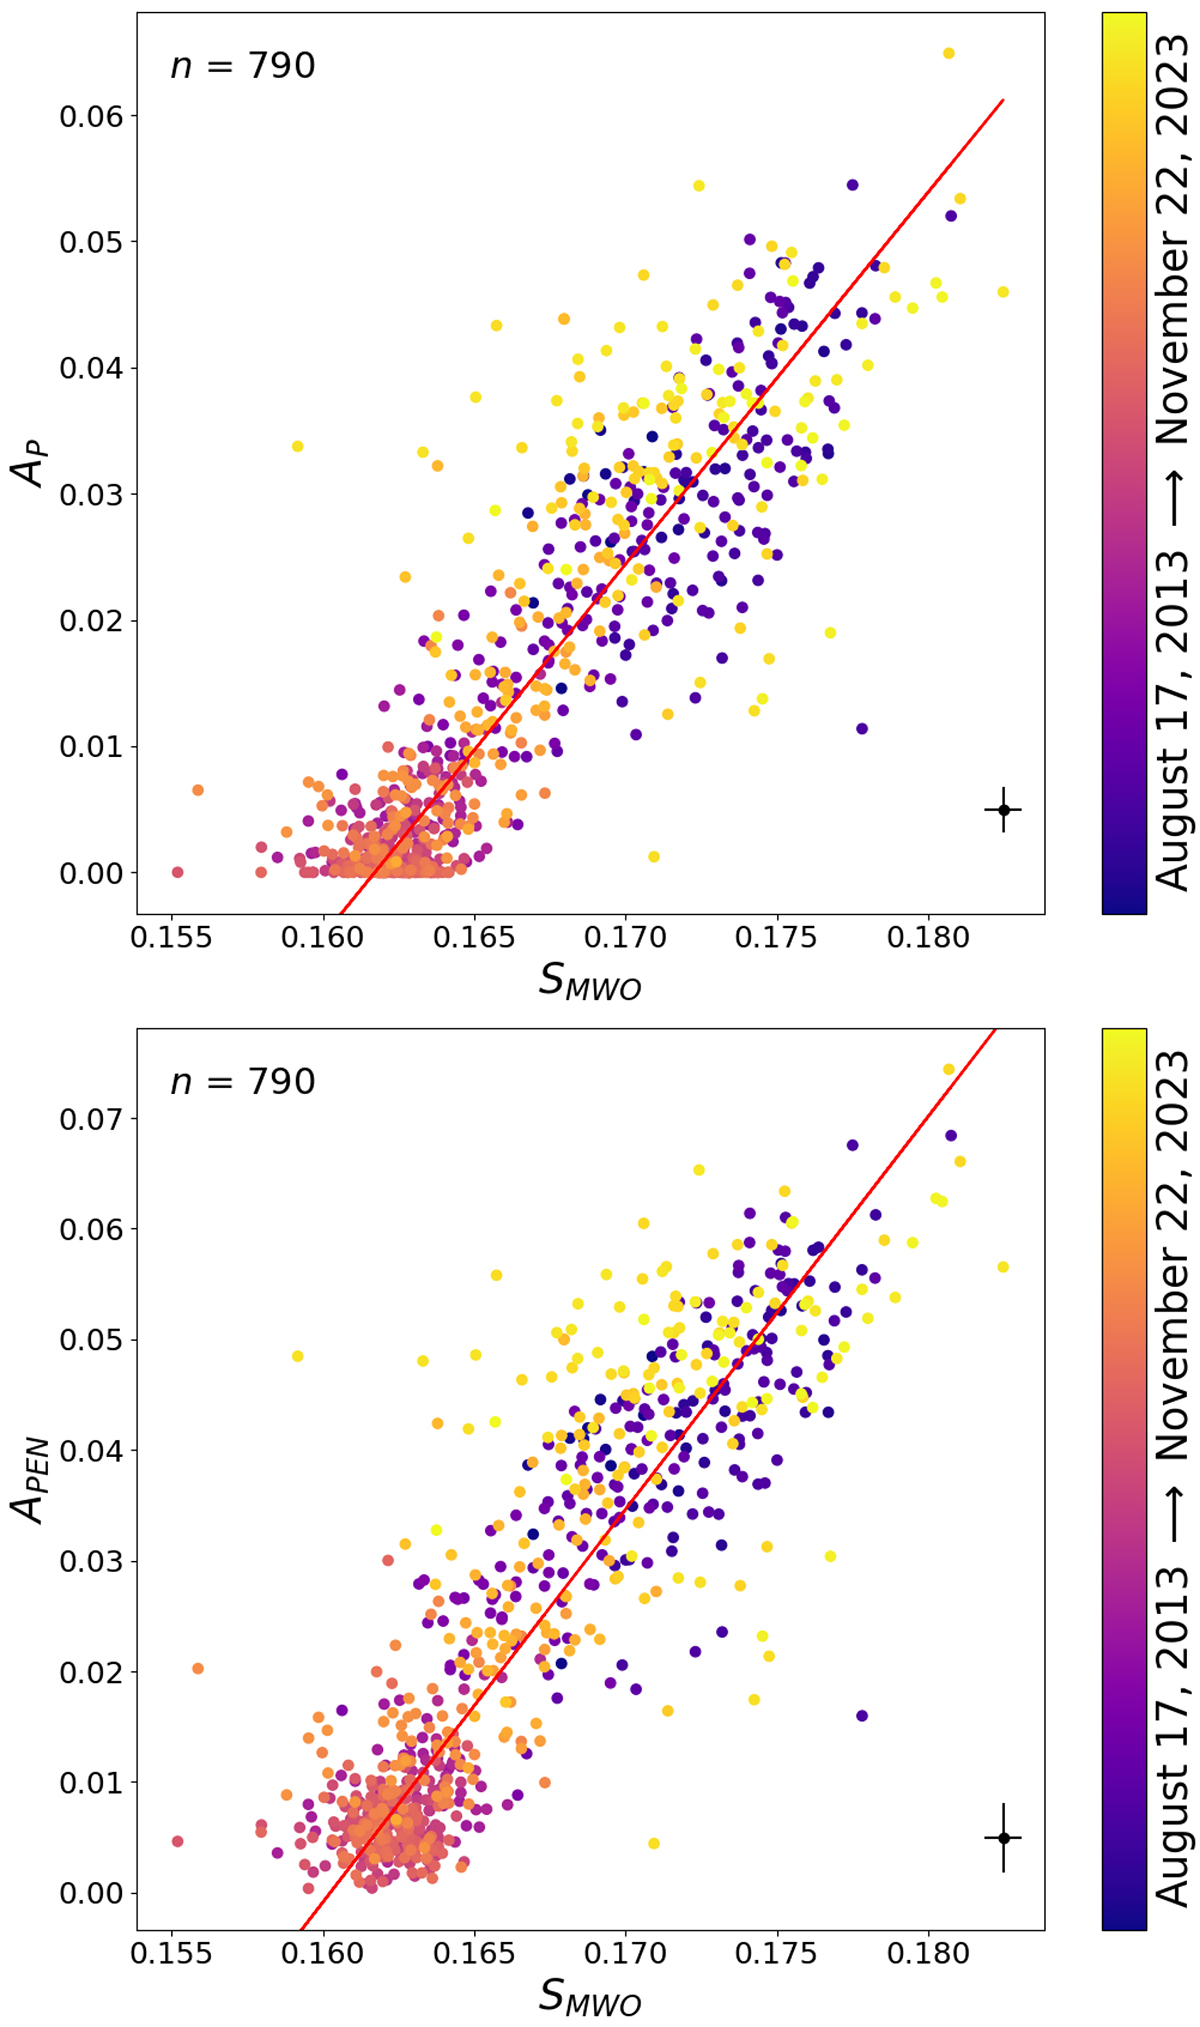
Correlation between daily values of the solar S-index from TIGRE (in the Mount Wilson scale) and the USET area fraction. Top panel: plages only, AP. Bottom panel: plages and enhanced network, APEN. The parameter n represents the number of data, and the chronological order is color-coded. The first and last date of the data are given next to the color bar. Additionally, a linear fit was performed to the data (red solid line). A mean error bar is displayed on the bottom right corner to have an idea of the uncertainties on the data.
Current usage metrics show cumulative count of Article Views (full-text article views including HTML views, PDF and ePub downloads, according to the available data) and Abstracts Views on Vision4Press platform.
Data correspond to usage on the plateform after 2015. The current usage metrics is available 48-96 hours after online publication and is updated daily on week days.
Initial download of the metrics may take a while.