Fig. 2
Download original image
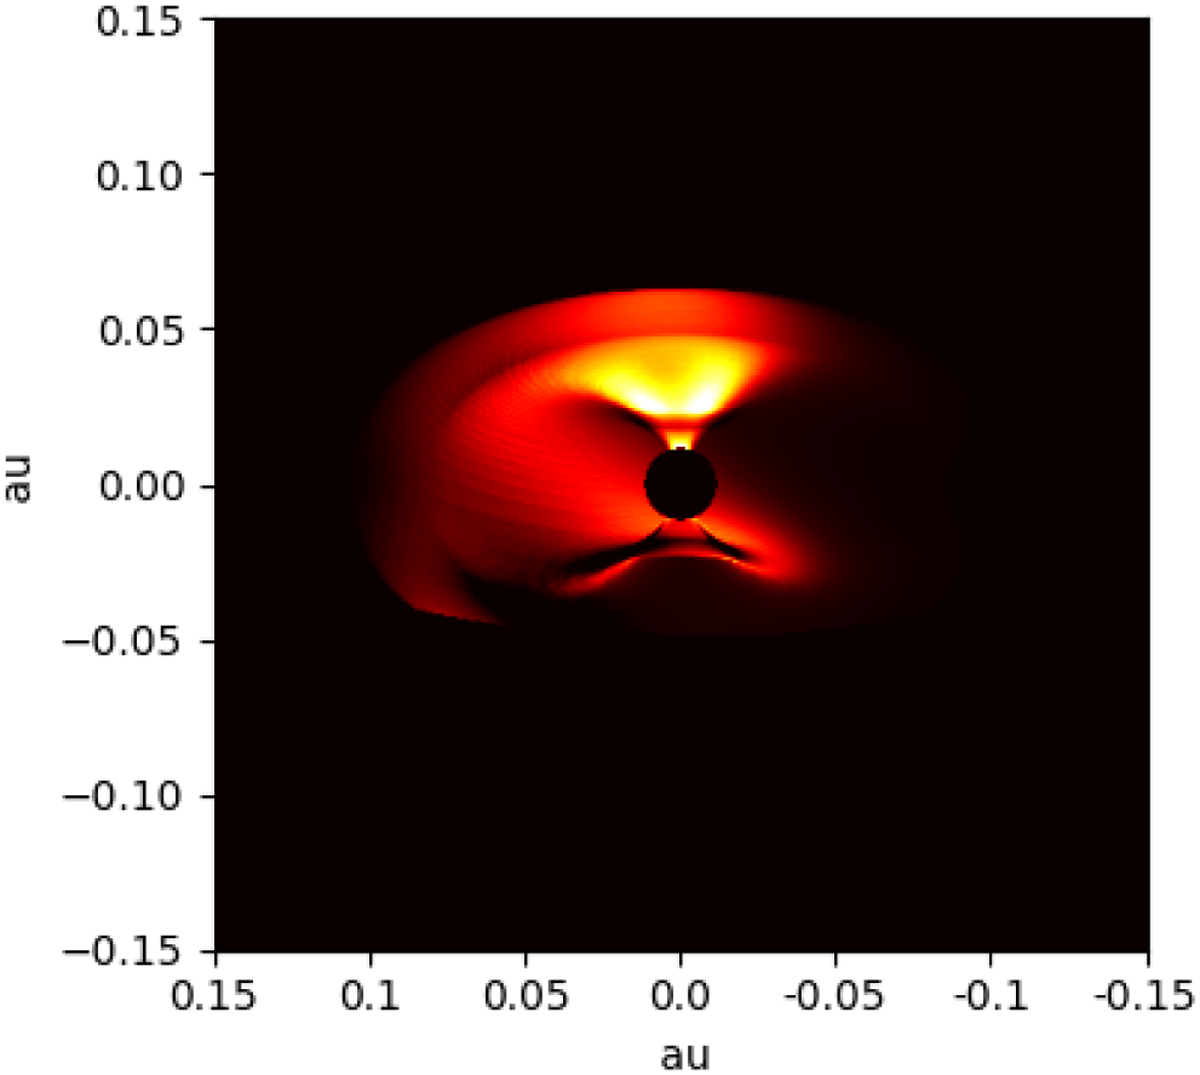
Example of a magnetospheric accretion model image, produced with the MCFOST radiative transfer code. Shown here is the continuum-subtracted Brγ emission region of a purely axisymmetric rotating magnetosphere with no additional emission components. Channel line maps such as this can be used to compute artificial interferometric observables which we are then able to compare to real observational data. The image here specifically shows the line map for the −69 km s−1 velocity channel.
Current usage metrics show cumulative count of Article Views (full-text article views including HTML views, PDF and ePub downloads, according to the available data) and Abstracts Views on Vision4Press platform.
Data correspond to usage on the plateform after 2015. The current usage metrics is available 48-96 hours after online publication and is updated daily on week days.
Initial download of the metrics may take a while.