Fig. A.2
Download original image
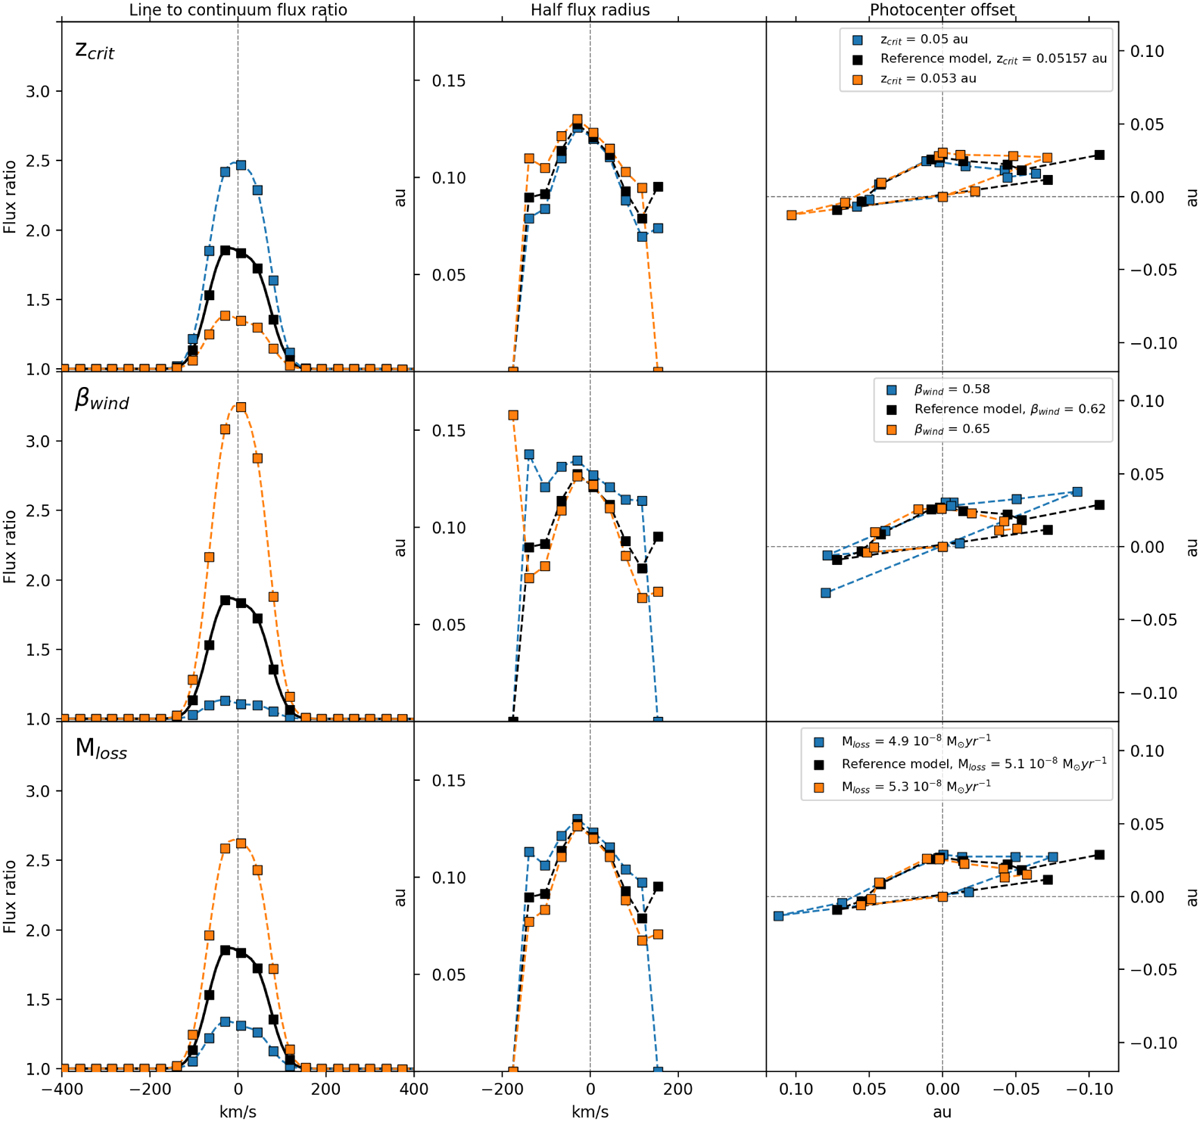
Observable dependencies on parameter changes for the top three disk wind parameters as ranked in Table A.2. The left column depicts the changes in continuum normalised line flux. The centre column shows a characteristic interferometric size, obtained as the half width at half maximum (HWHM) of a geometric Gaussian disk model. The right column illustrates the spatial distribution of line emission photocentres at different velocity channels.
Current usage metrics show cumulative count of Article Views (full-text article views including HTML views, PDF and ePub downloads, according to the available data) and Abstracts Views on Vision4Press platform.
Data correspond to usage on the plateform after 2015. The current usage metrics is available 48-96 hours after online publication and is updated daily on week days.
Initial download of the metrics may take a while.