Fig. 9.
Download original image
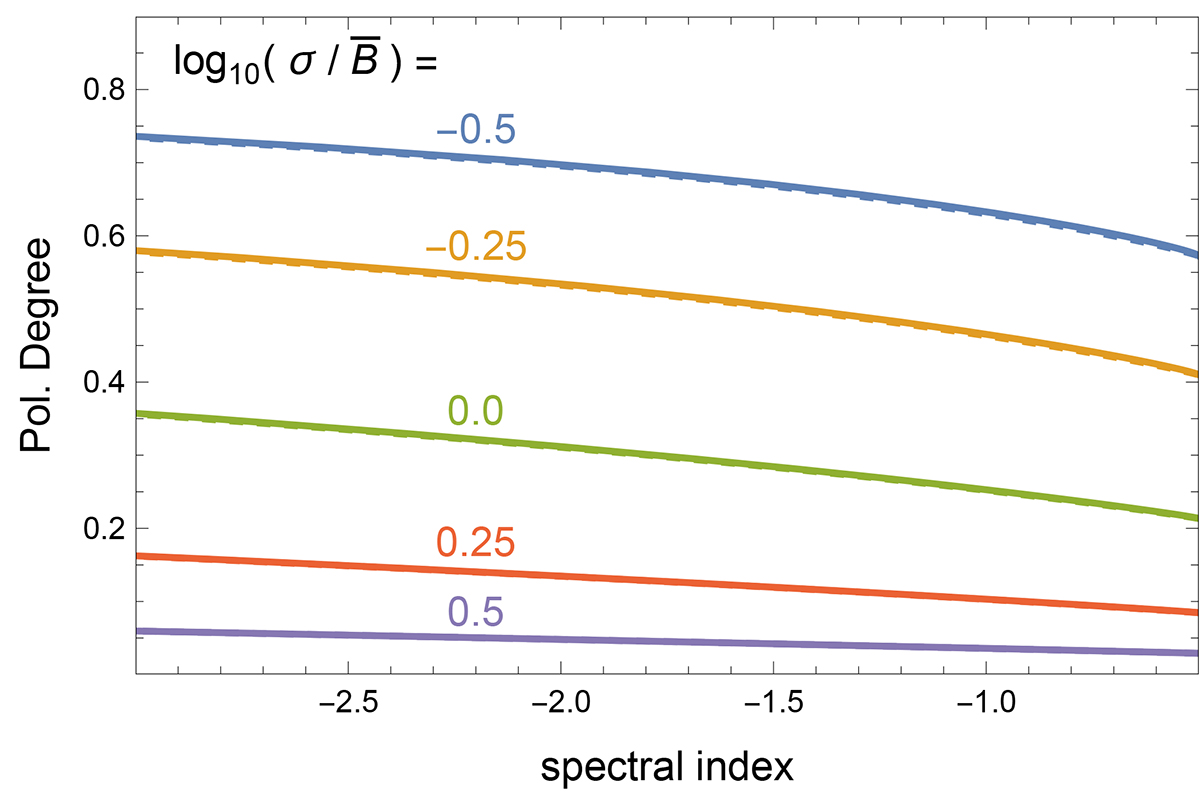
Dependence of Π on the local spectral index α, for s = 2 and various levels of the isotropic random fields. The choice of the levels is the same as in Fig. 1: it starts with ![]() , and then increases in steps of 0.25. Π decreases with increasing
, and then increases in steps of 0.25. Π decreases with increasing ![]() , and for values of
, and for values of ![]() the curves can no longer be distinguished from zero in the plot. The dashed lines refer to cases with β = 1, while the solid lines to β = 2. The corresponding curves are almost superimposed, which means that these correlations are very insensitive to the choice of β.
the curves can no longer be distinguished from zero in the plot. The dashed lines refer to cases with β = 1, while the solid lines to β = 2. The corresponding curves are almost superimposed, which means that these correlations are very insensitive to the choice of β.
Current usage metrics show cumulative count of Article Views (full-text article views including HTML views, PDF and ePub downloads, according to the available data) and Abstracts Views on Vision4Press platform.
Data correspond to usage on the plateform after 2015. The current usage metrics is available 48-96 hours after online publication and is updated daily on week days.
Initial download of the metrics may take a while.