Fig. 5.
Download original image
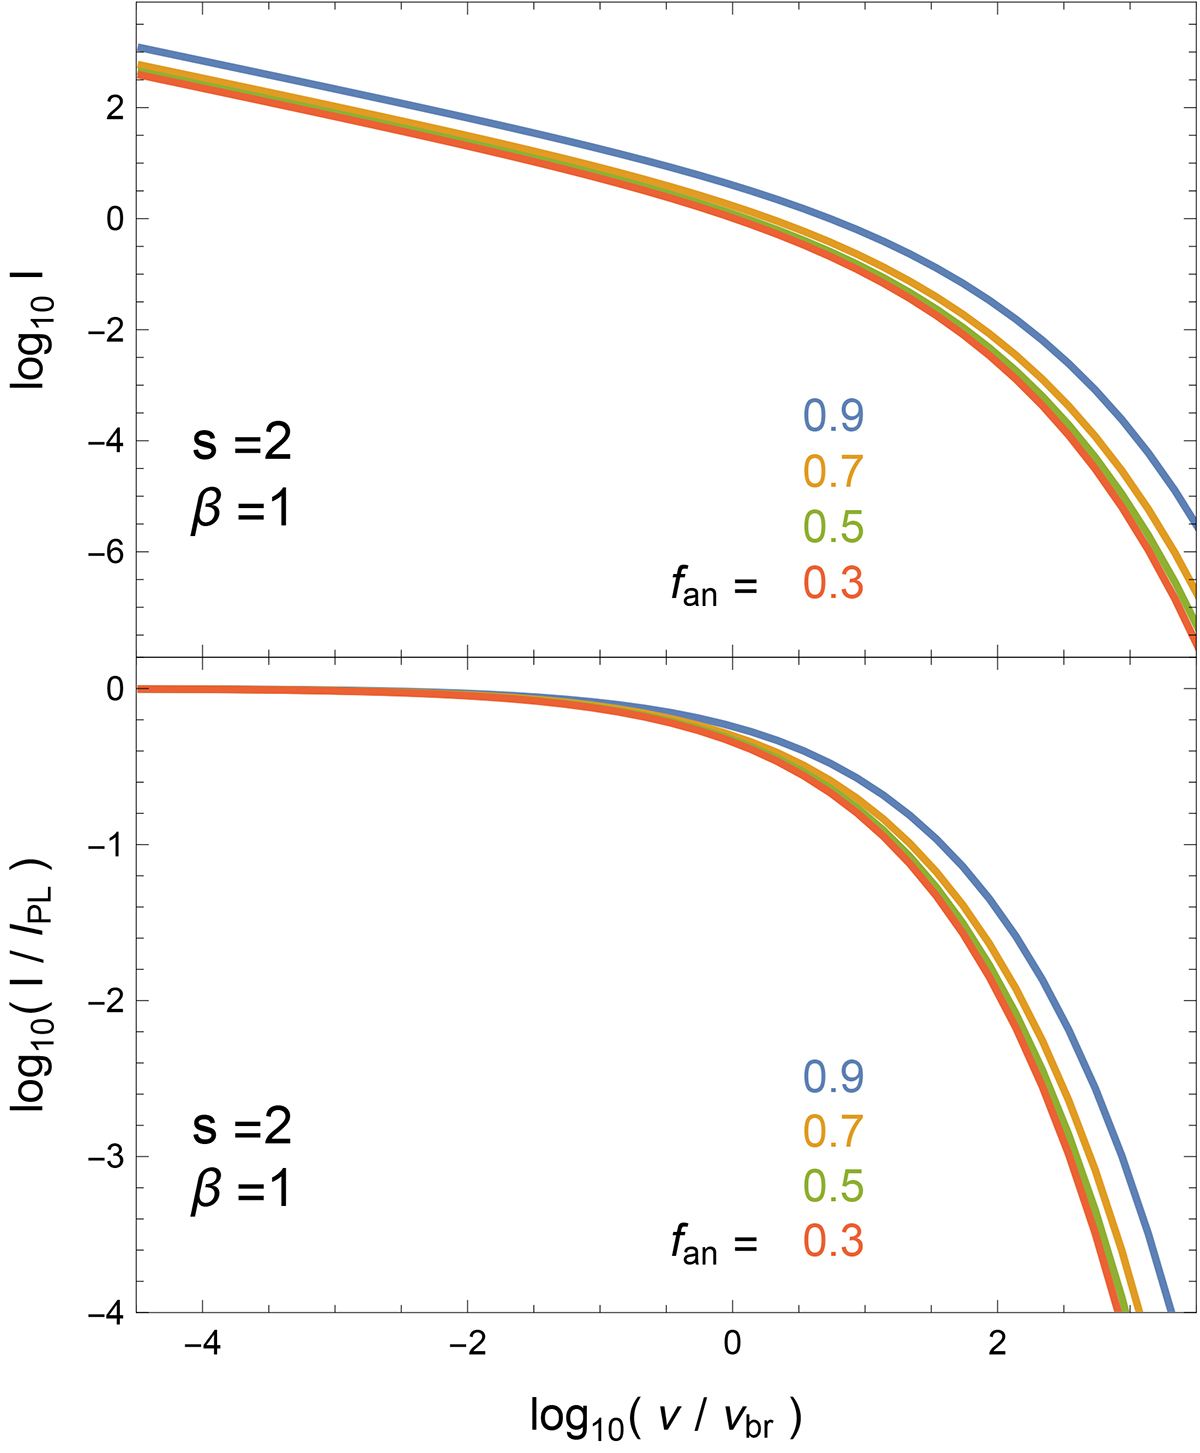
Spectra for ℐ, as plotted in Fig. 1, but for the anisotropic case, with ![]() . The various curves refer to different values of fan, ranging from 0.3 to 0.9 in steps of 0.2. The intensities increase with increasing fan. The differences between different models are lower than in the cases shown in Fig. 1 for the isotropic case. Here no black dashed curve is shown because now the spectrum for a homogeneous MF cannot be a limit case. The case with fan = 0.0 (isotropic random MF) is indistinguishable from the case fan = 0.3.
. The various curves refer to different values of fan, ranging from 0.3 to 0.9 in steps of 0.2. The intensities increase with increasing fan. The differences between different models are lower than in the cases shown in Fig. 1 for the isotropic case. Here no black dashed curve is shown because now the spectrum for a homogeneous MF cannot be a limit case. The case with fan = 0.0 (isotropic random MF) is indistinguishable from the case fan = 0.3.
Current usage metrics show cumulative count of Article Views (full-text article views including HTML views, PDF and ePub downloads, according to the available data) and Abstracts Views on Vision4Press platform.
Data correspond to usage on the plateform after 2015. The current usage metrics is available 48-96 hours after online publication and is updated daily on week days.
Initial download of the metrics may take a while.