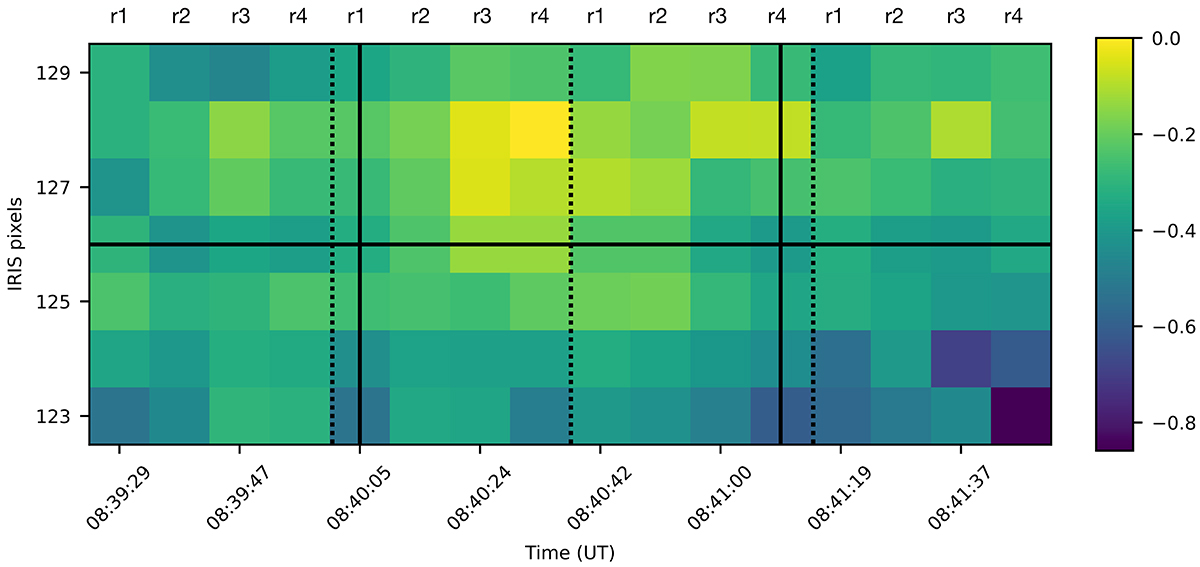
Fig. 9.
Download original image
Time series of Si IV spectroheliograms for QSEB – 1. The log of the normalized integrated line intensity for Si IV 1394 Å line shown by the green shaded region in Fig. 7h. Like in Fig 8, the vertical dashed lines mark the end of each of the rasters and the black vertical lines denote the start and end time of the QSEB. The black horizontal line denotes the location of the QSEB-1.
Current usage metrics show cumulative count of Article Views (full-text article views including HTML views, PDF and ePub downloads, according to the available data) and Abstracts Views on Vision4Press platform.
Data correspond to usage on the plateform after 2015. The current usage metrics is available 48-96 hours after online publication and is updated daily on week days.
Initial download of the metrics may take a while.